The EU Taxonomy, as adopted by EU policymakers, establishes criteria for considering economic activities to be environmentally sustainable. Under the Taxonomy, corporate economic activities are judged to be sustainable based on their potential to support the achievement of six objectives.
The first two Taxonomy objectives—climate change mitigation and climate change adaptation—are commonly known as the “climate objectives.” The remaining four objectives are sustainable use and protection of water and marine resources; transition to a circular economy; pollution prevention and control; and protection and restoration of biodiversity and ecosystems. A company’s economic activity can be considered environmentally sustainable if it substantially contributes to one of the six objectives while not significantly harming the others and if the company otherwise follows minimal safeguards.
From 2024, the EU Taxonomy has required non-financial and financial companies to disclose information both on their activities that are eligible to qualify as sustainable and activities that fully align with Taxonomy criteria for sustainability. Such data is disclosed by companies via the reporting templates set forth in the EU Taxonomy Disclosure Delegated Act.
As highlighted in a previous ISS Insights post, since 2023 ISS ESG’s EU Taxonomy Alignment Solution has provided investors with eligibility and alignment data. This article presents the results of EU Taxonomy reporting practices in 2024, as collected by ISS ESG, for both non-financial and financial companies. The main findings relate to the evolution of disclosures for the climate objectives, as well as observations based on the first year for which reporting on the environmental objectives is available.
The proposed EU Omnibus Package introduces several changes aiming to alleviate companies’ reporting burdens and to simplify the reporting templates. These changes are expected to improve disclosure availability as well as reported data quality. The analysis below aims to offer relevant insights into EU Taxonomy disclosure practices that can support financial market participants in preparing for the coming developments in taxonomy reporting.
Reporting Trends among Non-financial Companies
Overall Eligibility and Alignment
Since 2023, non-financial companies have been mandated to disclose the shares of their turnover, capital expenditure (CapEx), and operational expenditure (OpEx) that are eligible for and aligned with the two climate objectives. Beginning in 2024, non-financial companies also had to report the same eligibility data for the remaining four environmental objectives (alignment reporting for the environmental objectives was voluntary in 2024 and became mandatory for non-financial companies from 2025). Out of the 4,000 companies screened by ISS ESG for collecting reported EU Taxonomy data, fewer than 1,800 companies were found to disclose information using the EU Taxonomy reporting templates.
The observed increase in the average levels of eligibility for all three Key Performance Indicators (KPIs) in 2024, when compared to eligibility data in 2023 (Table 1), is mainly because of more activity-level disclosures by non-financial companies, as well as the new 2024 requirement of eligibility reporting on the remaining four environmental objectives.
Table 1: Average Eligible and Aligned KPI Percentages Reported for 2023 and 2024
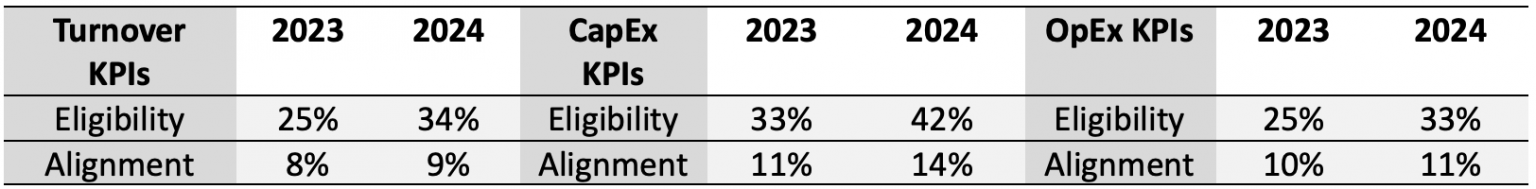
Source: ISS ESG
Across almost all sectors, CapEx was the KPI with the highest reported average eligibility and alignment. This pattern could be a signal of companies’ investments in transitioning their business operations towards sustainability by aligning with Taxonomy criteria. The pattern also indicates that it is more feasible for companies to align their capital expenditures with Taxonomy criteria than to align their turnover and operational expenditures.
The activities identified by the Taxonomy as contributing to the six sustainability objectives do not cover all industries, which means certain sectors report lower overall turnover generated from Taxonomy-eligible activities. For example, the Consumer Staples sector reported an average eligibility of 24.06% for CapEx but only 1.11% for turnover (Figure 2).
Figure 1: Average Reported Eligible and Aligned Turnover/CapEx/OpEx Share by GICS Sector
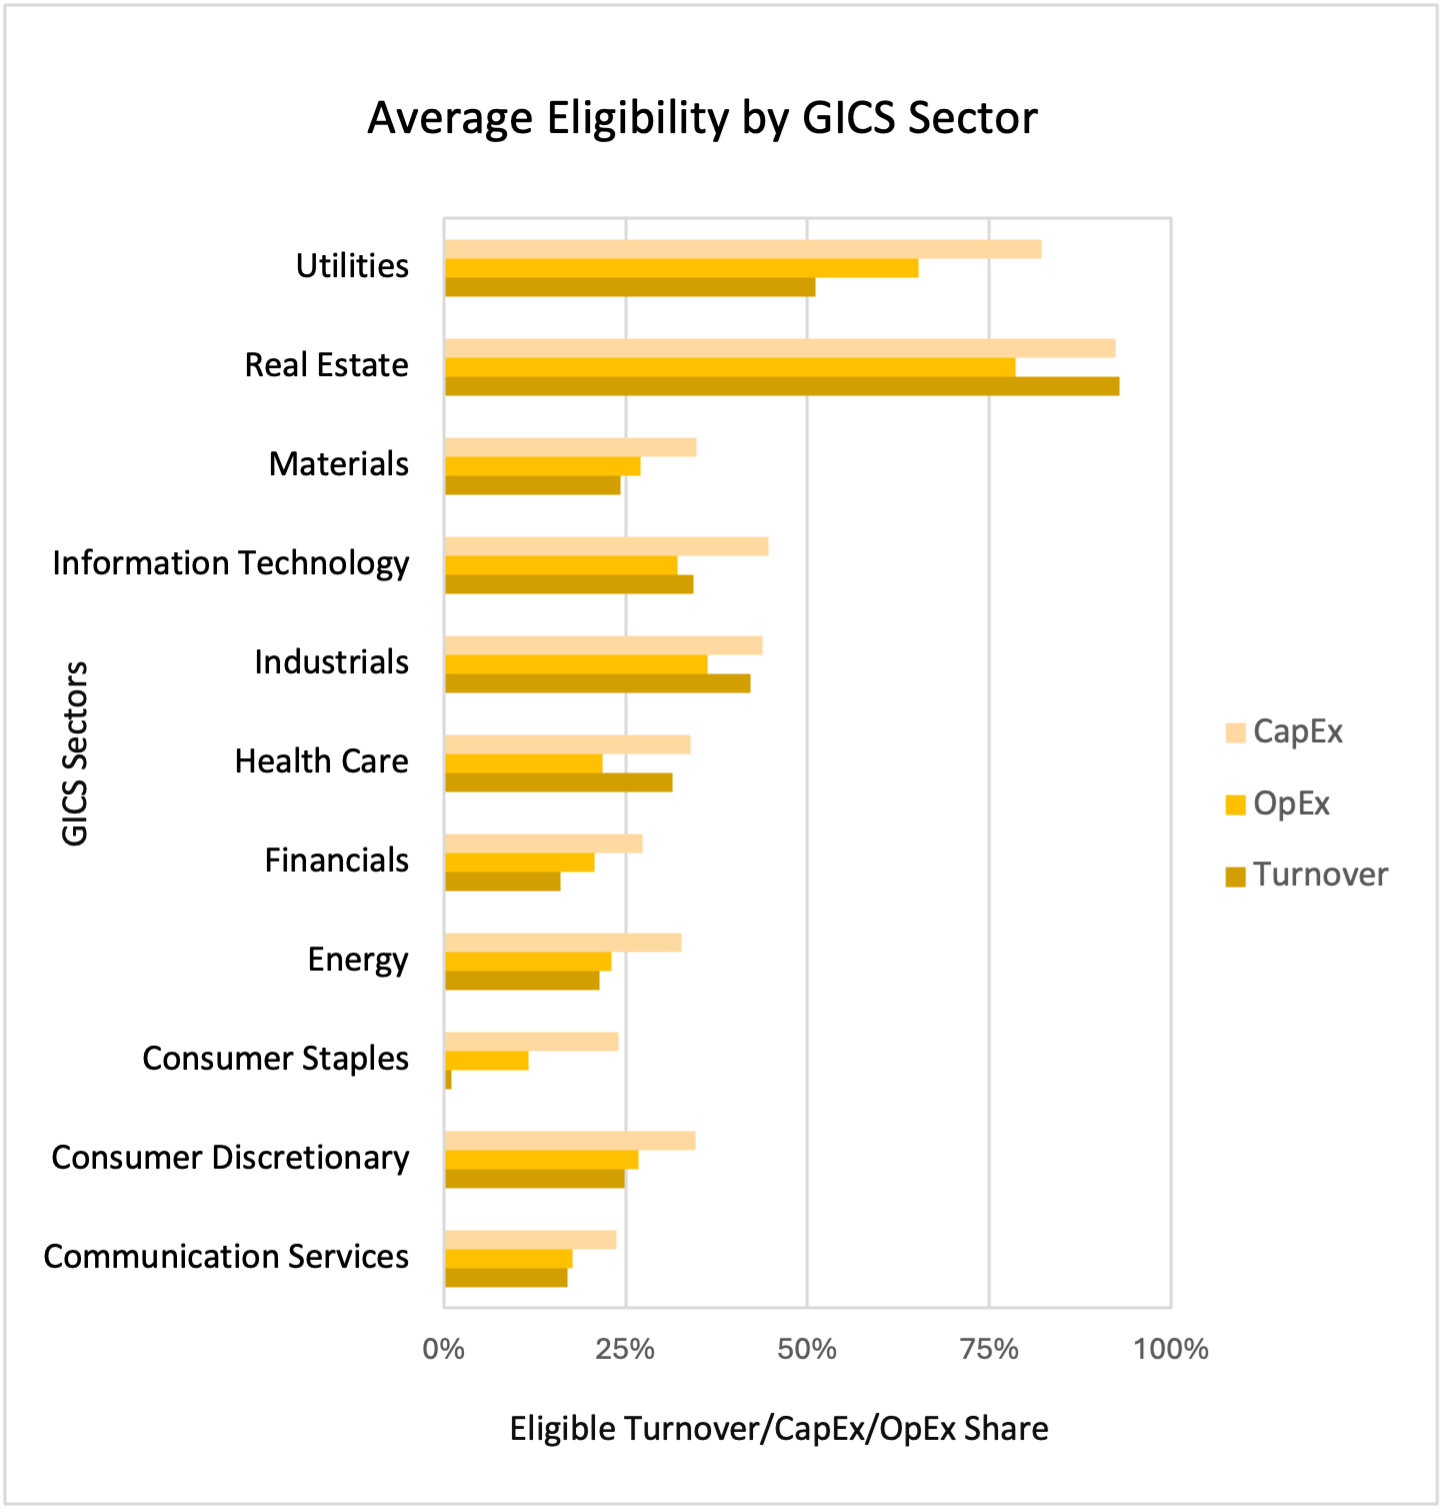
Source: ISS ESG
Consumer Staples companies are mostly involved in the production and distribution of goods such as food and beverages, which are not relevant for most Taxonomy activities, explaining their much lower average eligible turnover share.
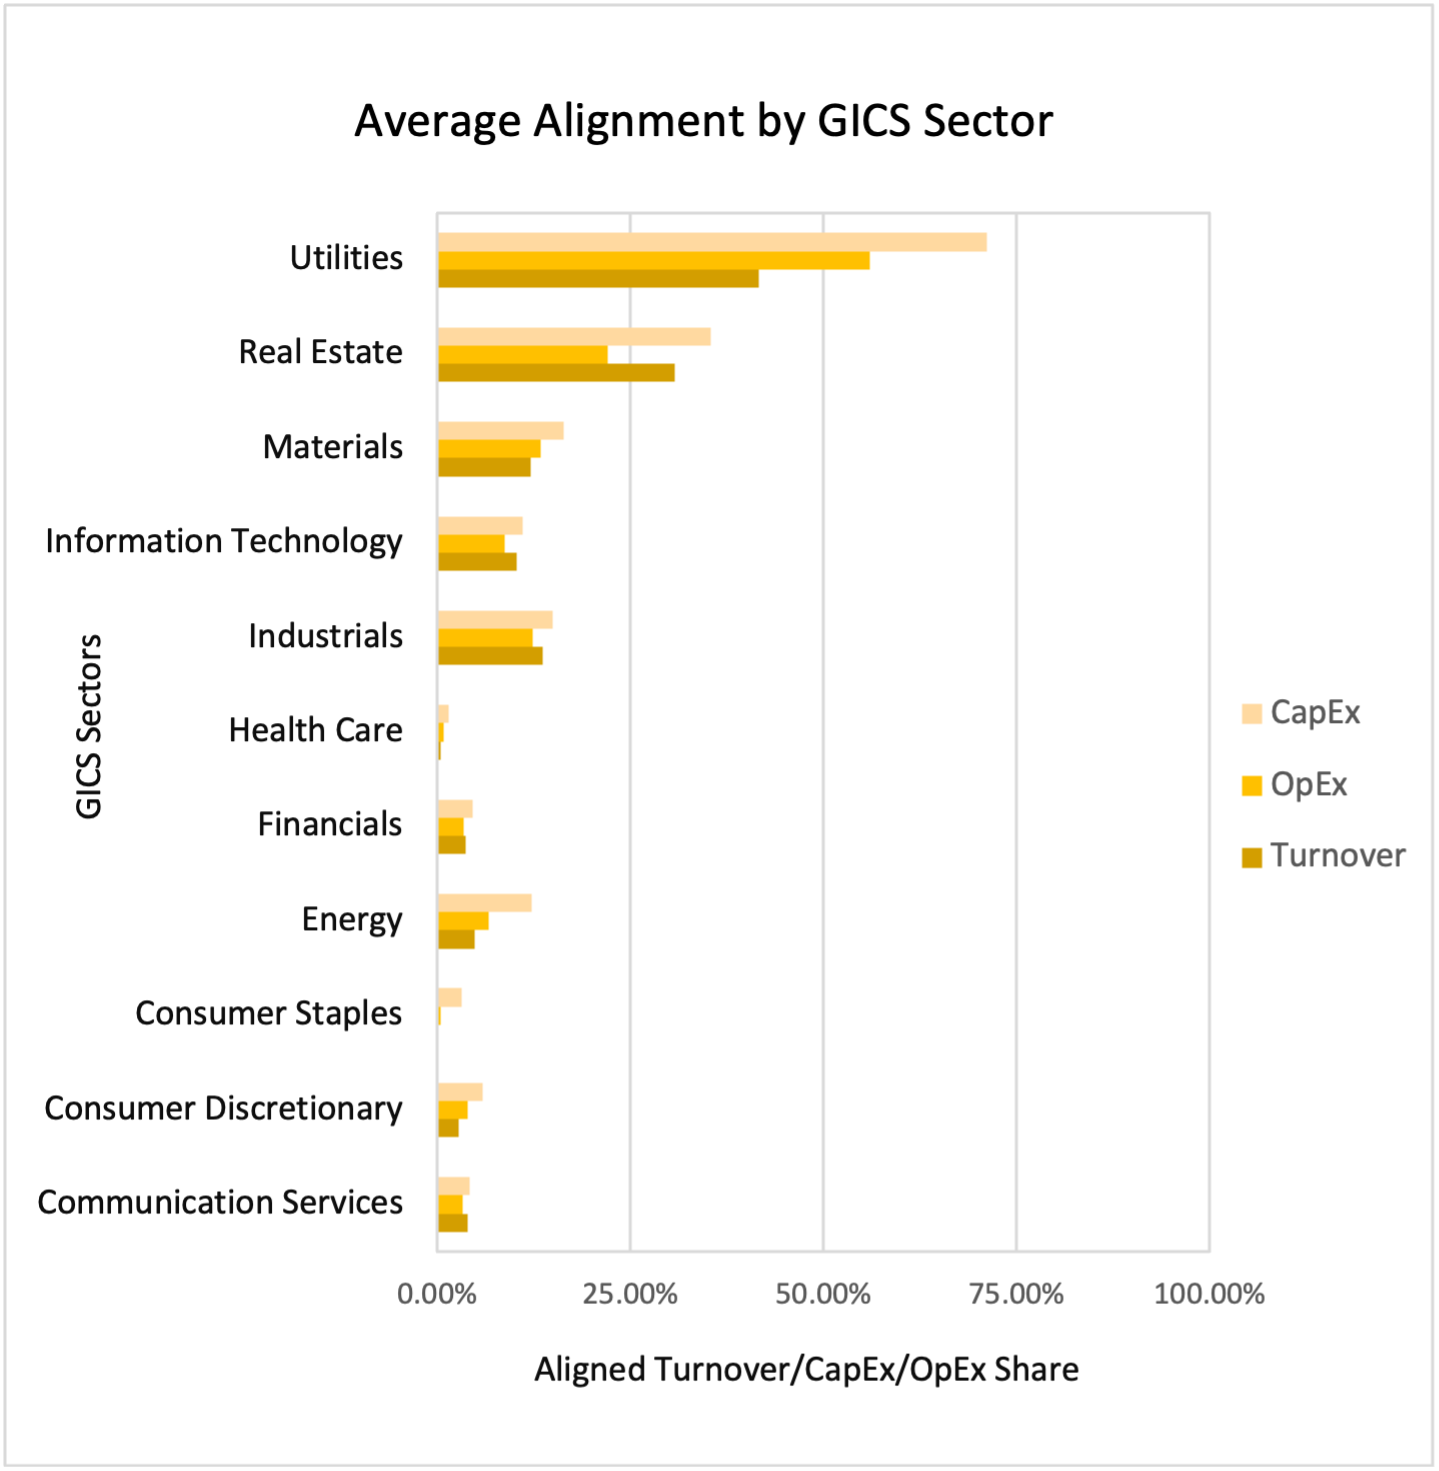
Among the sectors, Real Estate and Utilities reported the highest average eligibility and alignment for all three KPIs. Figure 3 shows the remarkably higher eligibility and alignment reported by these two sectors compared to other sectors for turnover.
Figure 2: Average Reported Eligible vs. Aligned Turnover Share by GICS Sectors
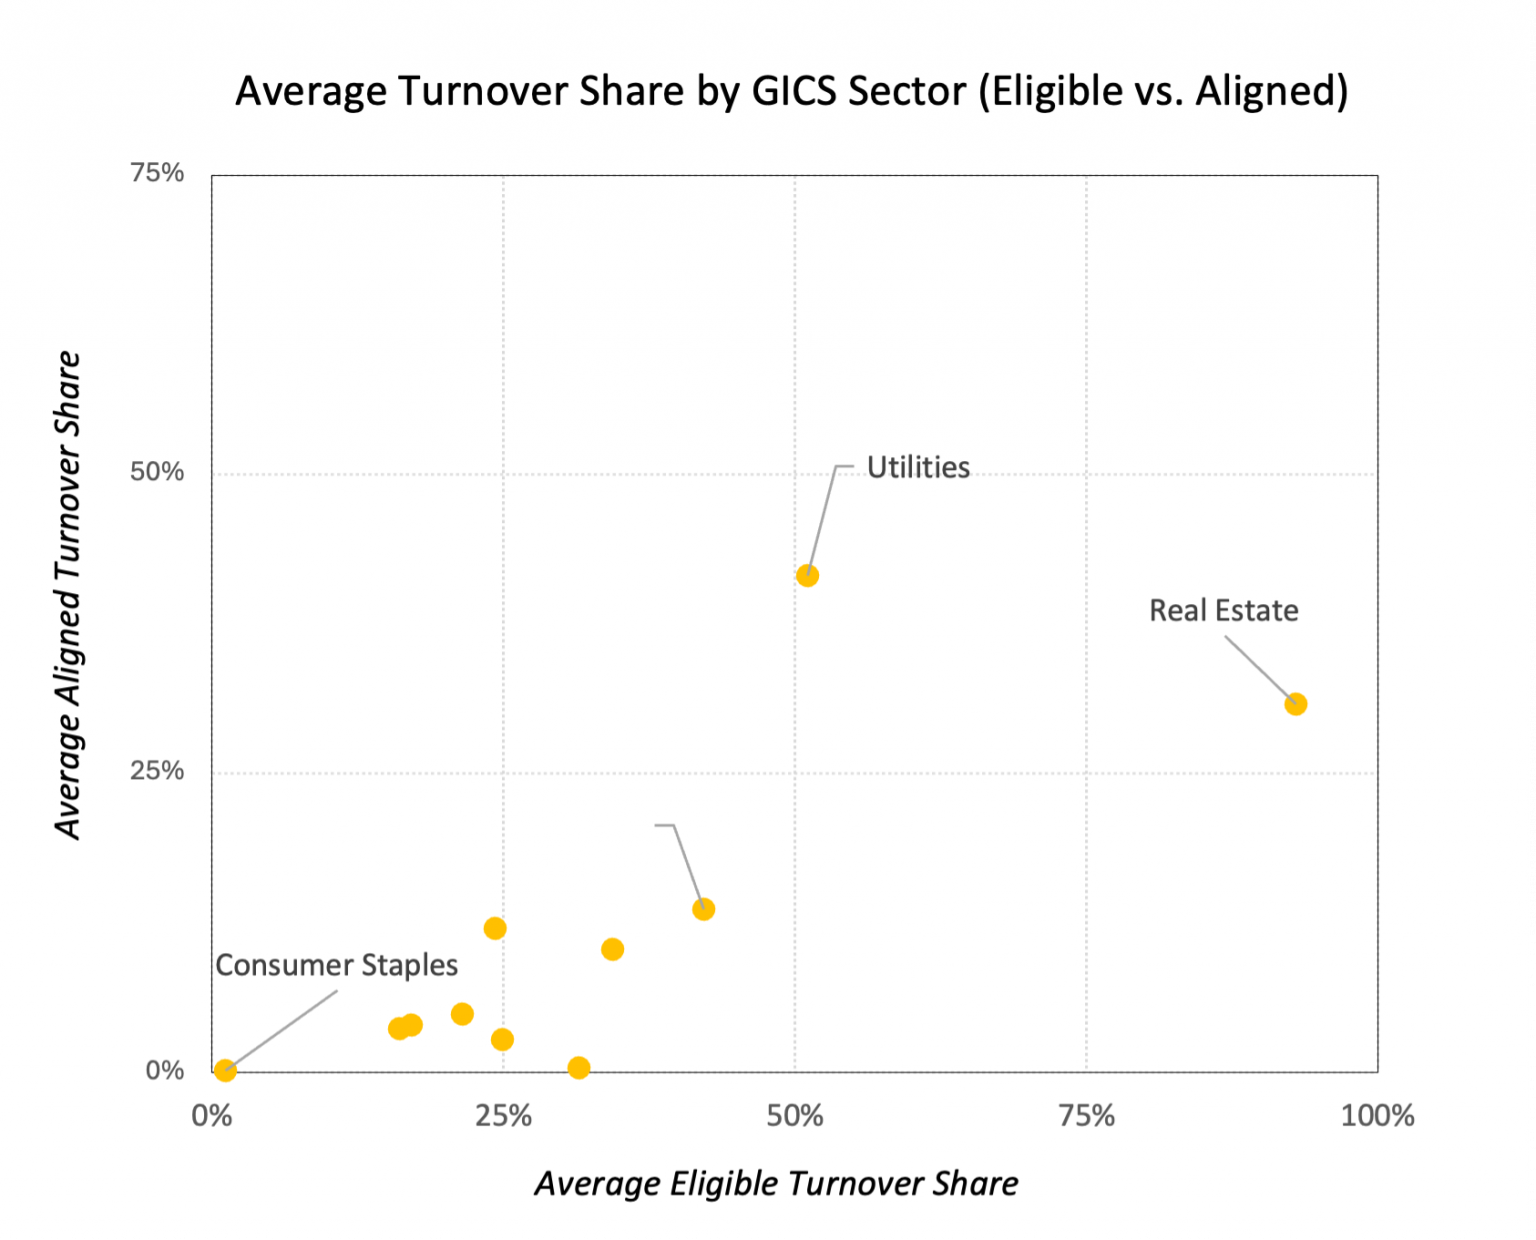
Source: ISS ESG
For Utilities, this high eligibility and alignment was expected, given that a considerable share of Taxonomy-related activities are related to electricity provision and distribution, utility infrastructure operation, and utility services provision. In contrast, the more homogenous business profile of companies in the Real Estate sector leads to the majority of them being eligible for Taxonomy activities such as Acquisition and Ownership of Buildings and Renovation of Existing Buildings. This resulted in a remarkably high average eligibility level for the whole sector, which to some extent had an impact on the comparatively higher alignment reported by the sector.
Looking further into sectors with high climate impact, Figure 4 below shows the top 10 Taxonomy-related economic activities reported for involvement by companies in high climate-impact sectors.
Figure 3: Top 10 Taxonomy-Related Economic Activities Reported for Involvement by High Climate Impact Sectors
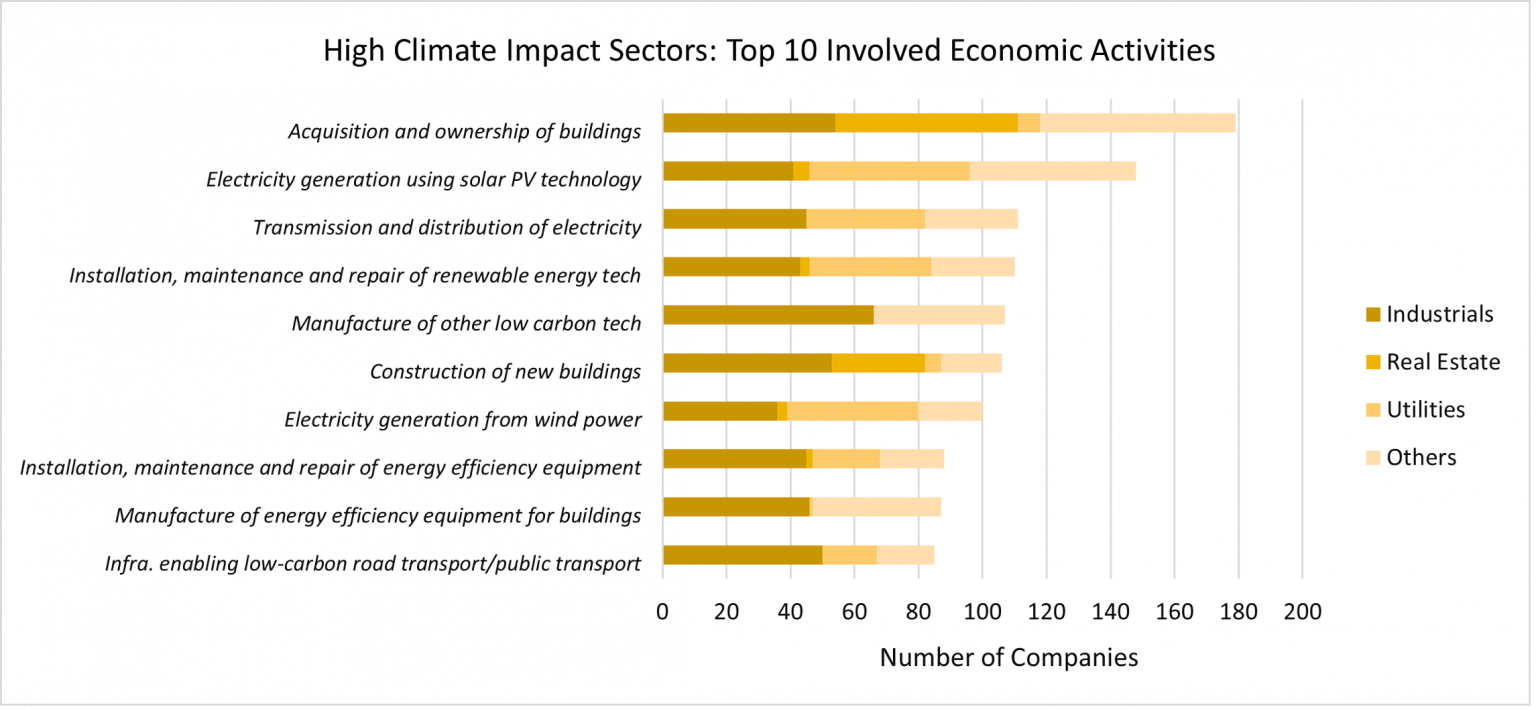
Source: ISS ESG
Companies in the Industrials, Real Estate, and Utilities sectors accounted for approximately 71% of reported eligible turnover generated from these activities. These three sectors were disclosed to be mostly involved in activities related to manufacturing and installation services (for Industrials), building construction and acquisition (for Real Estate), and electricity generation (for Utilities).
Reported Data for Specific Taxonomy Objectives
Besides their continuing reporting obligations for the two climate objectives, non-financial companies were mandated in 2024 to start disclosing eligibility for the remaining four environmental objectives, while alignment reporting was voluntary.
Overall, climate change mitigation had the highest reported levels of eligibility and alignment (Figure 5).
Figure 4: Average Reported Eligible and Aligned Turnover Share per Taxonomy Objective
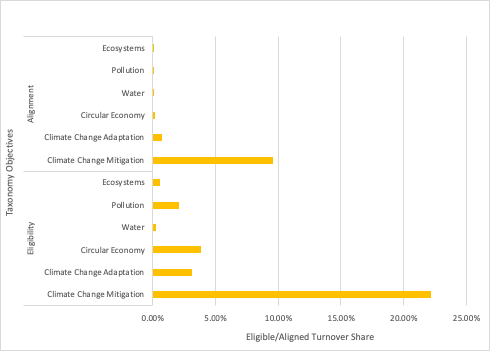
Source: ISS ESG
Between the two climate objectives, climate change adaptation had much lower reported eligibility and alignment levels than climate change mitigation, suggesting climate change mitigation was the objective more relevant to non-financials.
Possible factors contributing to the remarkably high eligibility and alignment reported for climate change mitigation include the following:
- The considerably higher number of Taxonomy activities eligible for the two climate objectives together (more than 100) compared to the four environmental objectives (approximately 40 for all objectives combined)
- Lower disclosure availability on alignment with the four environmental objectives due to the voluntary reporting in this area in 2024.
- Companies’ longer experiences in reporting on the two climate objectives, as well as assessing and improving their activities to align with Taxonomy criteria for these two objectives.
Among the four environmental objectives, Circular Economy had the highest reported eligibility across almost all sectors. This outcome is likely because of the higher number of Taxonomy activities eligible for this objective, as well as their wider applicability across sectors.
A significantly high average eligible turnover share was recorded under the Pollution objective for the Health Care sector (Table 2). This high eligibility was mainly driven by the sector’s involvement in the activities of manufacturing medicinal products and active pharmaceutical ingredients.
Table 2: Average Reported Eligible Turnover Share per Environmental Objective across GICS Sectors
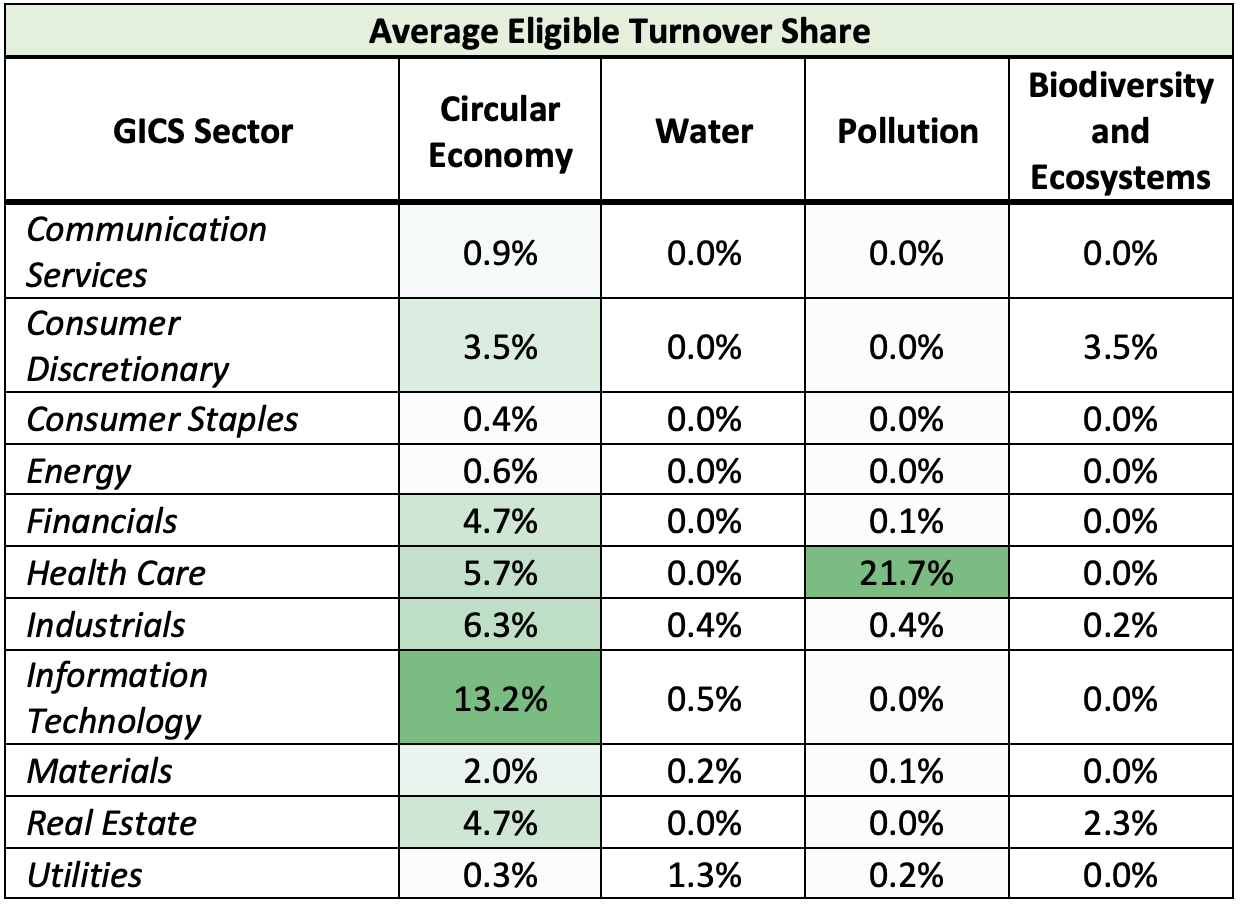
Source: ISS ESG
The overall low reported eligibility under the environmental objectives, apart from Circular Economy, is likely due to rather niche economic activities being eligible for these objectives. As a result, such activities are concentrated in only certain industries. Figure 6 shows that higher eligibility was reported by the GICS Industry Groups whose business is more closely related to the activities defined under these environmental objectives.
Figure 5: Average Reported Eligibility and Alignment Levels for Turnover, by GICS Industry Group
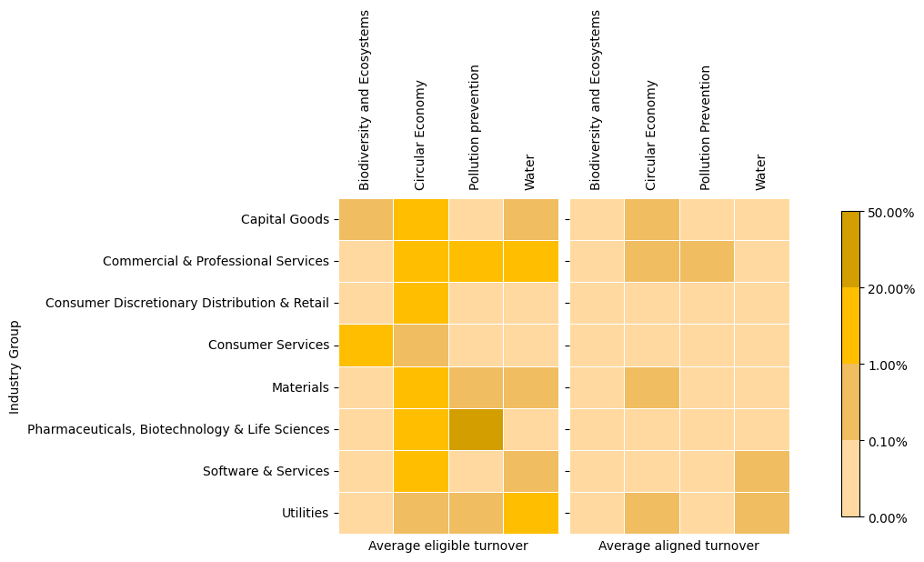
Source: ISS ESG
The Pollution objective, as mentioned above, recorded a remarkably high eligibility for the Pharmaceutical, Biotechnology & Life Sciences industry group.
Under the Water objective, waste and wastewater treatment and water-supply-related activities by the Commercial & Professional Services and Utilities industry groups drove the higher eligible turnover share, while low or no eligibility was recorded for other industries.
For Biodiversity, as this objective has only two Taxonomy activities with niche business operations, most industries report no eligibility except for Consumer Services, due to this industry’s involvement in the hotel and tourism accommodation activity.
Differing Disclosures among Non-financial Companies
When collecting Taxonomy reported data, ISS ESG has also observed certain differences in companies’ reporting. Specifically, several issuers, while disclosing their overall shares of turnover, CapEx, and OpEx for Taxonomy-eligible and aligned activities, did not provide disaggregated, objective-specific eligibility and alignment data. In a more extreme instance, about 2% of non-financial companies who disclosed certain overall eligible and aligned share values disclosed 0% for all objective-specific eligibility and alignment values.
Another recorded difference in disclosure practice was that some companies who disclosed objective-specific data reported a much higher level of eligibility and alignment for specific objectives than for overall values, suggesting different denominators were used for computing values in different fields within the reporting template. These variances in reporting practices to some extent have an impact on the disclosed data patterns as analyzed above, such as the lower level of objective-specific eligibility and alignment data disclosed than the overall value data disclosed.
Reporting Trends among Financial Companies
The taxonomy reporting template for Credit Institutions requires banks to calculate their KPI’s exposure to taxonomy alignment. The KPI for a bank is the Green Asset Ratio (GAR), which showcases the proportion of a credit institution’s assets that are financing and invested in taxonomy-aligned economic activities, as a proportion of total covered assets.
For context, the GAR has been designed to help the bank assess and explain the environmental quality of its balance sheet to attract environmentally conscious customers and investors. The aim of this disclosure is to create more transparency for the “green” qualities of credit institutions’ balance sheets, thus attracting investors and future customers to achieve a higher GAR.
Other financial institutions, such as asset managers and insurance companies as well as investment firms, use the KPI of Green Investment Ratio (GIR). GIR represents the proportion of investments in Taxonomy-eligible and -aligned activities relative to the value of all covered assets under management (AUM), including money managed on behalf of third parties as well as on their own account.
In 2024, 204 financial companies disclosed on their Green Asset Ratios (GAR) / Green Investment Ratios (GIR) KPIs for the first time. Out of these, ISS ESG observed approximately 154 financial companies reporting under the credit institutions template (Table 3).
Table 3: Average GAR KPIs Disclosed by Credit Institutions in 2024
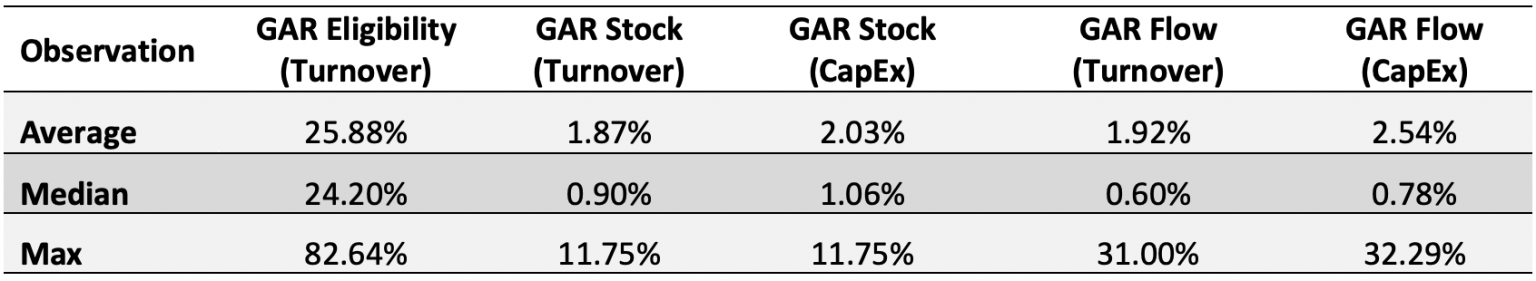
Source: ISS ESG
While the average eligibility for the GAR KPI based on turnover was almost 26%, the actual average GAR (stock) KPIs based on turnover and CapEx were just 1.87% and 2.03%, respectively. These figures improved marginally in the case of the GAR flow KPIs. (GAR stock refers to the KPI as of the disclosure reference date, and GAR flow refers to the KPI during the year prior to the disclosure reference date.) However, the biggest difference was the significant variability of the GAR KPIs across banks, with the highest GAR stock KPIs for turnover reaching almost 12% while GAR Flow KPIs for turnover reached 31%.
Table 4 shows further analysis of the coverage and composition of the KPI numerator and denominator.
Table 4: Coverage and Exclusion Values Disclosed by Credit Institutions
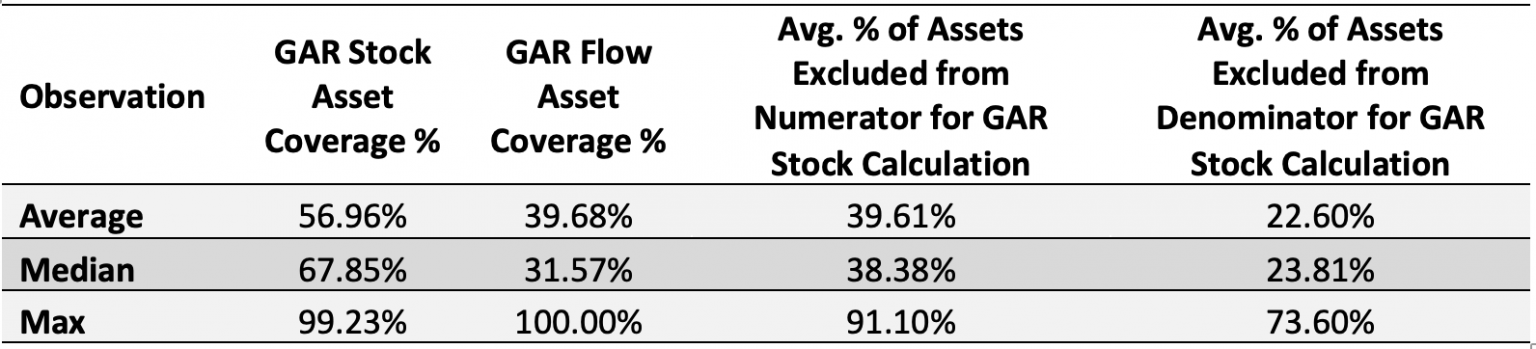
Source: ISS ESG
These numbers indicate the considerable variability in the average, median, and max GAR KPIs across banks. This variability might stem from the gap in terms of KPI coverage as well as the numerator / denominator exclusions. The variability reflects the differing nature of the underlying loan books as well as varied interpretations of the underlying calculations by banks. As a result, the Green Asset Ratio KPI, in its current form, does not appear to be a reliably comparable metric for taxonomy alignment across different financial market participants.
In the case of insurance companies, an analysis of the 46 reporting insurance companies indicated a similar pattern, where major variations were seen in the Green Investment Ratios. Disclosure data is also observed to be limited: an analysis of ISS ESG’s reported taxonomy data universe indicated that only 20 Asset Managers and 3 Investment Firms reported on their taxonomy disclosures in 2024.
Finally, ISS ESG observed that, while many financial conglomerates reported under more than one financial template, most of them did not disclose the weighted average KPI consolidating their different financial KPIs, as recommended in the 3rd Commission Notice published in November 2024. One possible challenge to disclosing this data point could be that there currently exists no standardized template to report on such a KPI. As a consultation took place on amendments to the Disclosures Delegated Act, this challenge could be addressed with the new reporting templates being recommended.
Conclusion
Overall, collected Taxonomy disclosures throughout 2024 exhibit fewer available disclosures than expected (fewer than 1,800 companies out of 4,000 screened), generally low reported alignment, and certain variations in disclosure. While some of these observations, such as the lower reported alignment level for the four environmental objectives, can be explained through the nature of the Taxonomy and its phase-in reporting obligations, the remaining observations suggest variance in the interpretation of the templates, as well as varying disclosure practices, both of which, to some extent, are the result of the rather complex template structure. Looking ahead, the Omnibus Proposal introduces several changes aiming to alleviate companies’ reporting burdens as well as simplify the reporting templates, which may improve disclosure availability as well as reported data quality.
Explore ISS STOXX solutions mentioned in this report
- Financial market participants across the world face increasing transparency and disclosure requirements regarding their investments and investment decision-making processes. Let the deep and long-standing expertise of the ISS ESG Regulatory Solutions team help you navigate the complexities of global ESG regulations.
Authored By
Phuong Anh Nguyen, ESG Methodology, Regulatory Solutions and Fixed Income
Navaneet Desai, ESG Product, Regulatory Solutions
Bharat Juyal, ESG Methodology, Regulatory Solutions and Fixed Income
See More