Key Takeaways
- Climate scientists at NOAA estimate a 75% chance of an historic El Niño weather event that could exceed the strength of all previous such events dating back to 1950.
- El Niño may affect corporate issuers through multiple and often unexpected macro and micro channels. At the macro level, food inflation driven by lower crop yields, higher energy prices, and productivity loss may result in weaker GDP growth. At the micro level, individual assets may suffer interruptions or lower productive capacity.
- As an illustrative analysis, this article relies on the ISS STOXX Geospatial Asset Database (GAD) to extract the geolocated assets of issuers within the ~2400-stock STOXX AC World global benchmark of liquid large and mid-cap securities.
- Focusing on regions anticipated to be impacted by El Niño, the article identifies corporate exposures by asset location, asset type, and issuer. By leveraging the GAD, investors may take initial steps to understand their investments’ exposure and potential vulnerabilities.
A Possible Super El Niño Event in 2026-27
On June 11, 2026, the US National Oceanic and Atmospheric Administration (NOAA) issued a formal advisory that the El Niño natural and recurring weather phenomenon had developed in the Tropical Pacific. NOAA declares an El Niño when equatorial Pacific sea surface temperatures are 0.5°C above average for several consecutive months.
Subsequently, on September 10, NOAA advised in its official outlook that El Niño was strengthening, with a greater-than-90% chance of a very strong event. Furthermore, NOAA estimated a 75% chance of an historic event that would exceed the strength of all previous El Niño events dating back to 1950, or a so-called super El Niño.
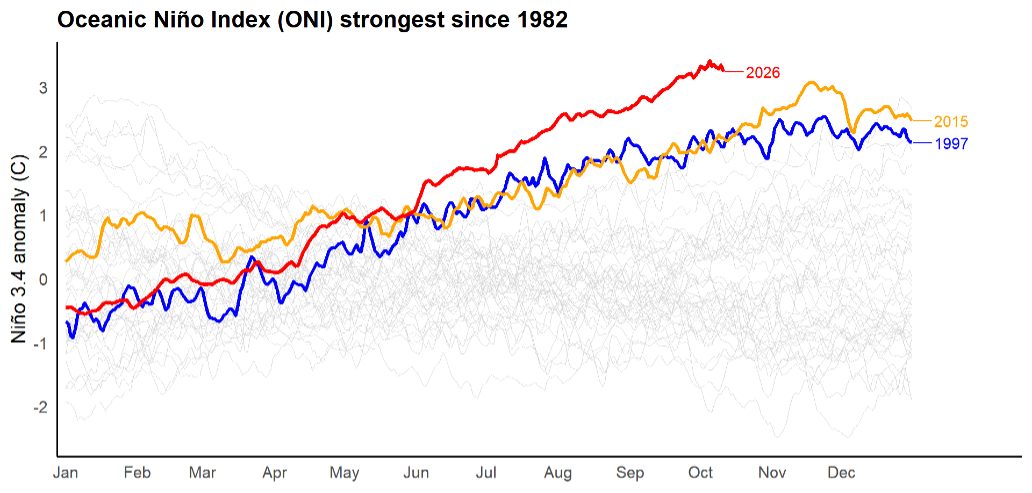
NOAA noted that, “With an event of this magnitude, the chances of experiencing impacts consistent with El Niño are larger, though not guaranteed.” The Oceanic Niño Index (ONI) (Figure 1) illustrates the magnitude of the current temperature anomaly compared with all years since 1982. The two previous strongest events occurred in 2015-16 and 1997-98. Other national weather agencies such as the UK Met office have issued similar advisories.
Figure 1: Oceanic Niño Index, 1982–2026
Global Weather Impacts
While forecasters note that every cycle is different, the impacts of El Niño patterns are felt around the world and are typically marked by:
- Increased rainfall in parts of Ecuador and Peru, as well as wetter-than-average conditions in Eastern Africa, Chile, Uruguay, and Paraguay.
- Markedly drier regions of Africa, India, Australia, the Philippines, Indonesia, the Caribbean, and northern South America. These drier conditions lead to increased risk of wildfires.
- A wetter Boreal winter across the southern US states, from southern California and the southwest to Florida and the southeast. A milder and drier winter in the northwest and northern Rockies to the midwest.
- No consistent pattern in Europe, indirectly affected via changes in atmospheric circulation.
To track and visualize El Niño’s development this cycle, climate scientist Dr. Zeke Hausfather has published a climate dashboard aggregating the forecasts of 13 climate models of leading meteorological agencies around the world. The summary of the regional impacts is shown in Figure 2.
Figure 2: Forecasted Regional Impacts of 2026-2027 El Niño
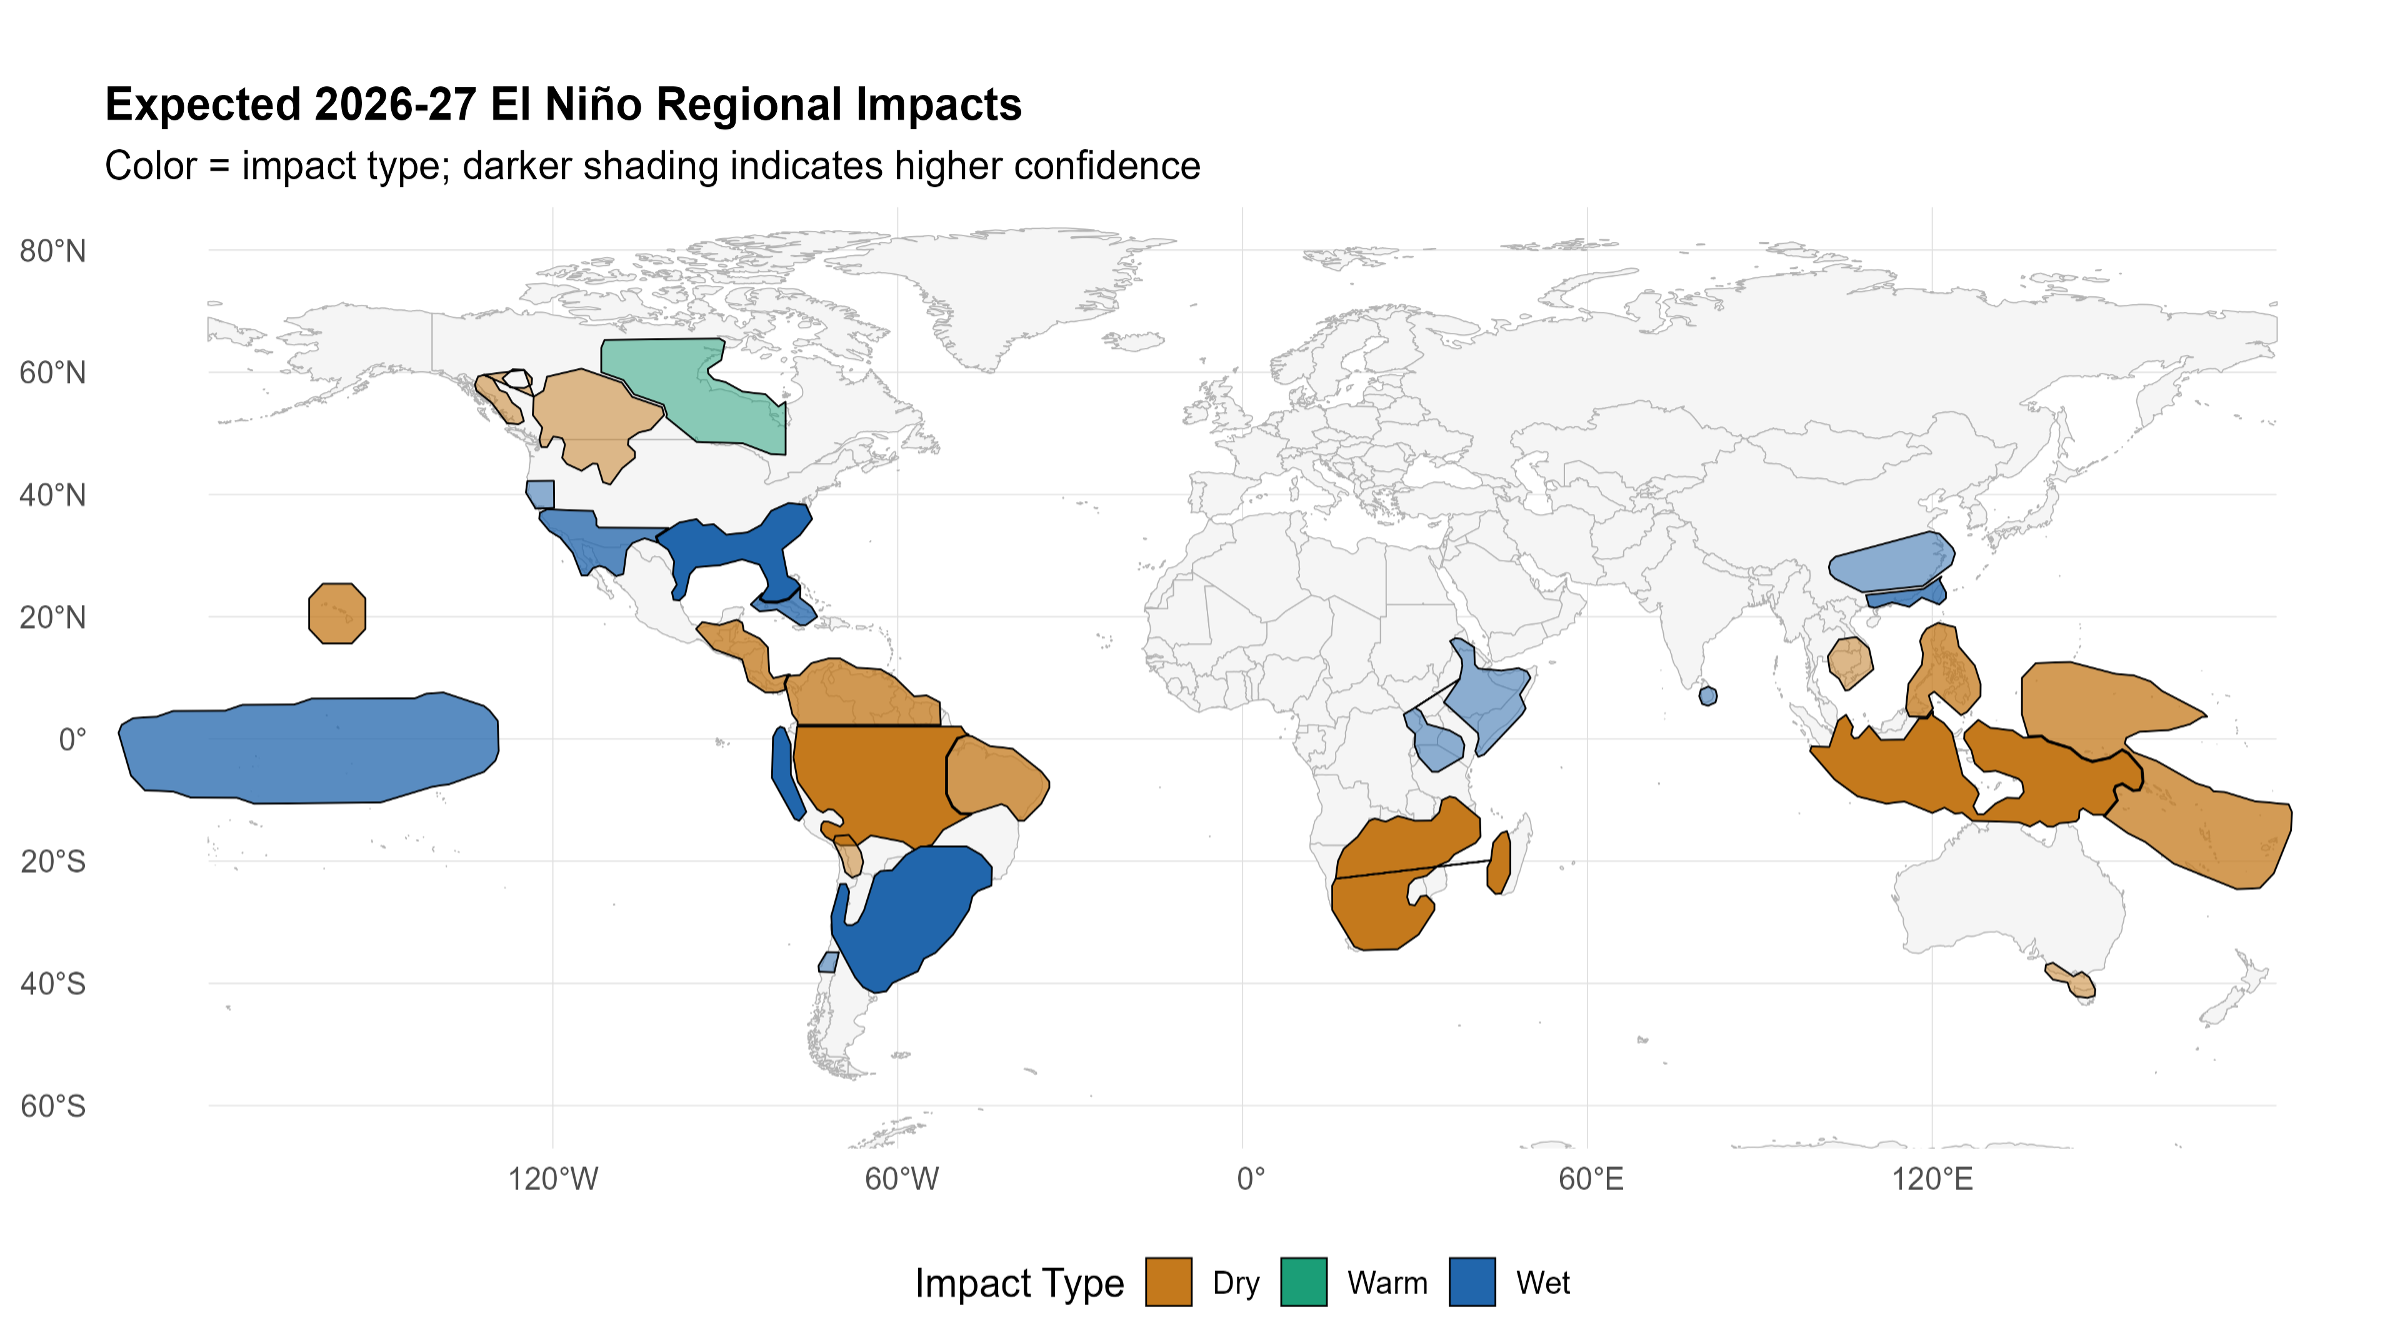
Figure 3: Forecasted Impacts of 2026-2027 El Niño, by Region, Impact Type, and Confidence Level
| Region | Impact | Confidence |
| Indonesia & Maritime Continent | Dry | High |
| Southern Africa | Dry | High |
| Amazon | Dry | High |
| Peru / Ecuador Coast | Wet | High |
| Southeast South America | Wet | High |
| US Gulf Coast & Southeast | Wet | High |
| Philippines | Dry | Medium-high |
| Northern South America | Dry | Medium-high |
| Northeast Brazil | Dry | Medium-high |
| Central America & Southern Caribbean | Dry | Medium-high |
| West Pacific Islands | Dry | Medium-high |
| Hawaii | Dry | Medium-high |
| Cuba & Bahamas | Wet | Medium-high |
| Southern California, US Southwest, & Northern Mexico | Wet | Medium-high |
| Southern China | Wet | Medium-high |
| Central Pacific Islands | Wet | Medium-high |
| Southeast Australia | Dry | Medium |
| Interior British Columbia, Northern Rockies, & Inland Northwest | Dry | Medium |
| Central Canada | Warm | Medium |
| Southern Mekong | Dry | Medium |
| Horn of Africa | Wet | Medium |
| Altiplano | Dry | Medium |
| Central Chile | Wet | Medium |
| Northern California | Wet | Medium |
| Sri Lanka | Wet | Medium |
| Yangtze Basin | Wet | Medium |
Source: Dr. Zeke Hausfather, El Niño 2026-27 Impact Dashboard
The analysis reveals 26 regions of interest, classified with either a “Dry,” “Wet,” or “Warm” impact. In addition, the degree of confidence in the forecasts for 2026-27 are “High,” “Medium-high,” or “Medium.” The “low” confidence forecast regions are omitted from the analysis.
Potential Disruptive Impacts
El Niño may affect corporate issuers through multiple and often unexpected macro and micro channels. For instance, at the macro level, food inflation driven by lower crop yields, higher energy prices, and productivity loss may result in weaker GDP growth, even in regions outside the directly exposed areas. Typical examples of disruption include droughts affecting important crops such as rice, sugar, coffee, palm oil, and wheat, for instance. Hydropower in dry regions may also be curtailed. Water transportation may be disrupted, notably the Panama Canal. Conversely, wet regions may see disruption from heavy rainfall and flood risk.
In this article, the analysis focuses on issuers’ asset-level exposure to the affected regions. The article does not consider macro impacts but examines solely asset-level exposure to explore potential vulnerabilities. At the micro level, individual assets may suffer from business interruptions or lower productive capacity.
The article does not consider any mitigation that affected issuers or countries may conduct. As a purely location-based analysis that does not consider the economic value of each exposed asset, this is not a comprehensive analysis but rather a starting point for deeper research on individual corporate exposure.
STOXX AC World Asset-Level Portfolio Analysis
As an illustrative portfolio analysis, this article relies on the ISS STOXX Geospatial Asset Database (GAD) to extract the geolocated corporate assets of issuers within the ~2400-stock STOXX AC World global benchmark of liquid large and mid-cap securities. Within this equity index, the analysis has geolocated approximately 1.2 million assets around the globe, encompassing ~90% of the issuers in the index. The analysis then performs a spatial join to focus solely on assets located within the El Niño regions, a step which reduces the number of assets to 310,000, an asset-exposure rate of 27%.
Figure 4 overlays the STOXX AC World geolocated assets over the affected regions.
Figure 4: STOXX AC World Assets Exposed to El Niño Regions
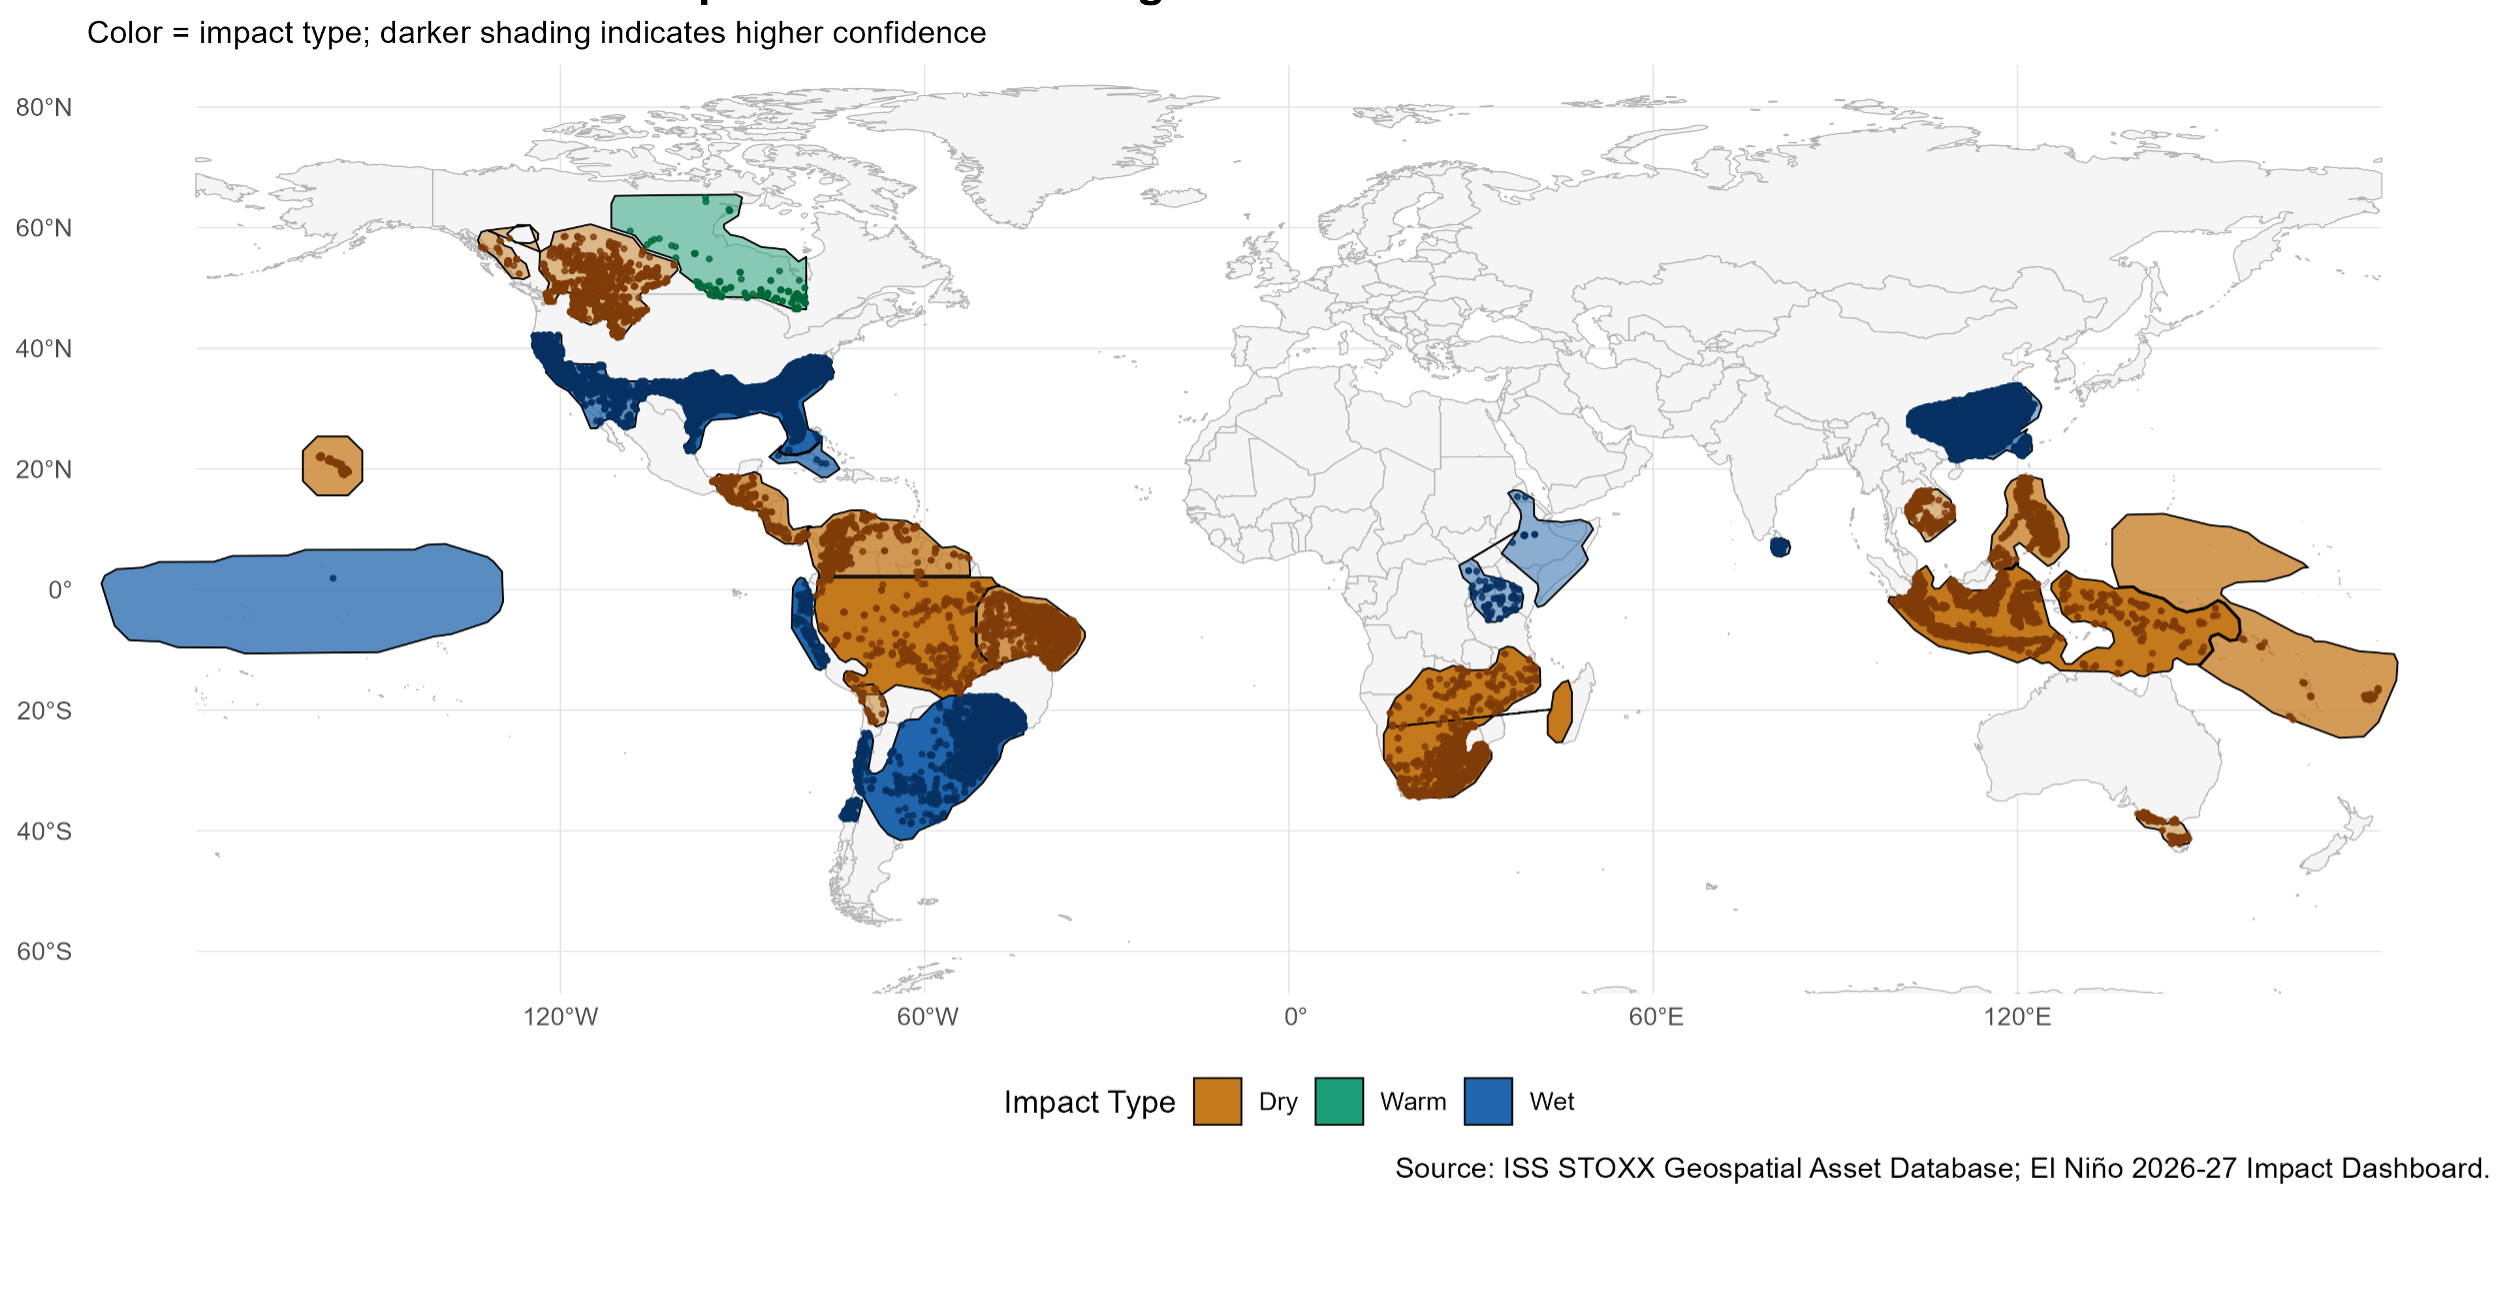
Source: ISS STOXX Geospatial Asset Database; El Niño 2026-27 Impact Dashboard
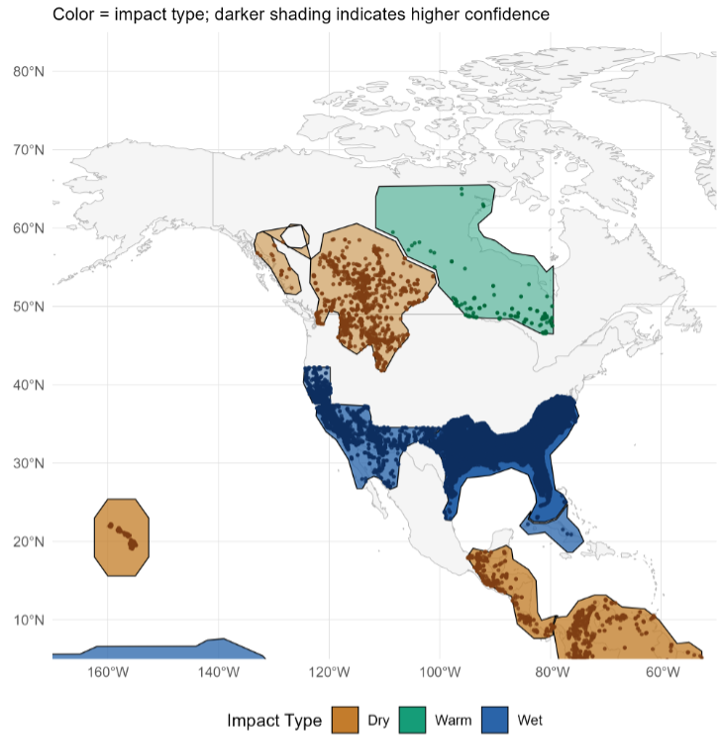
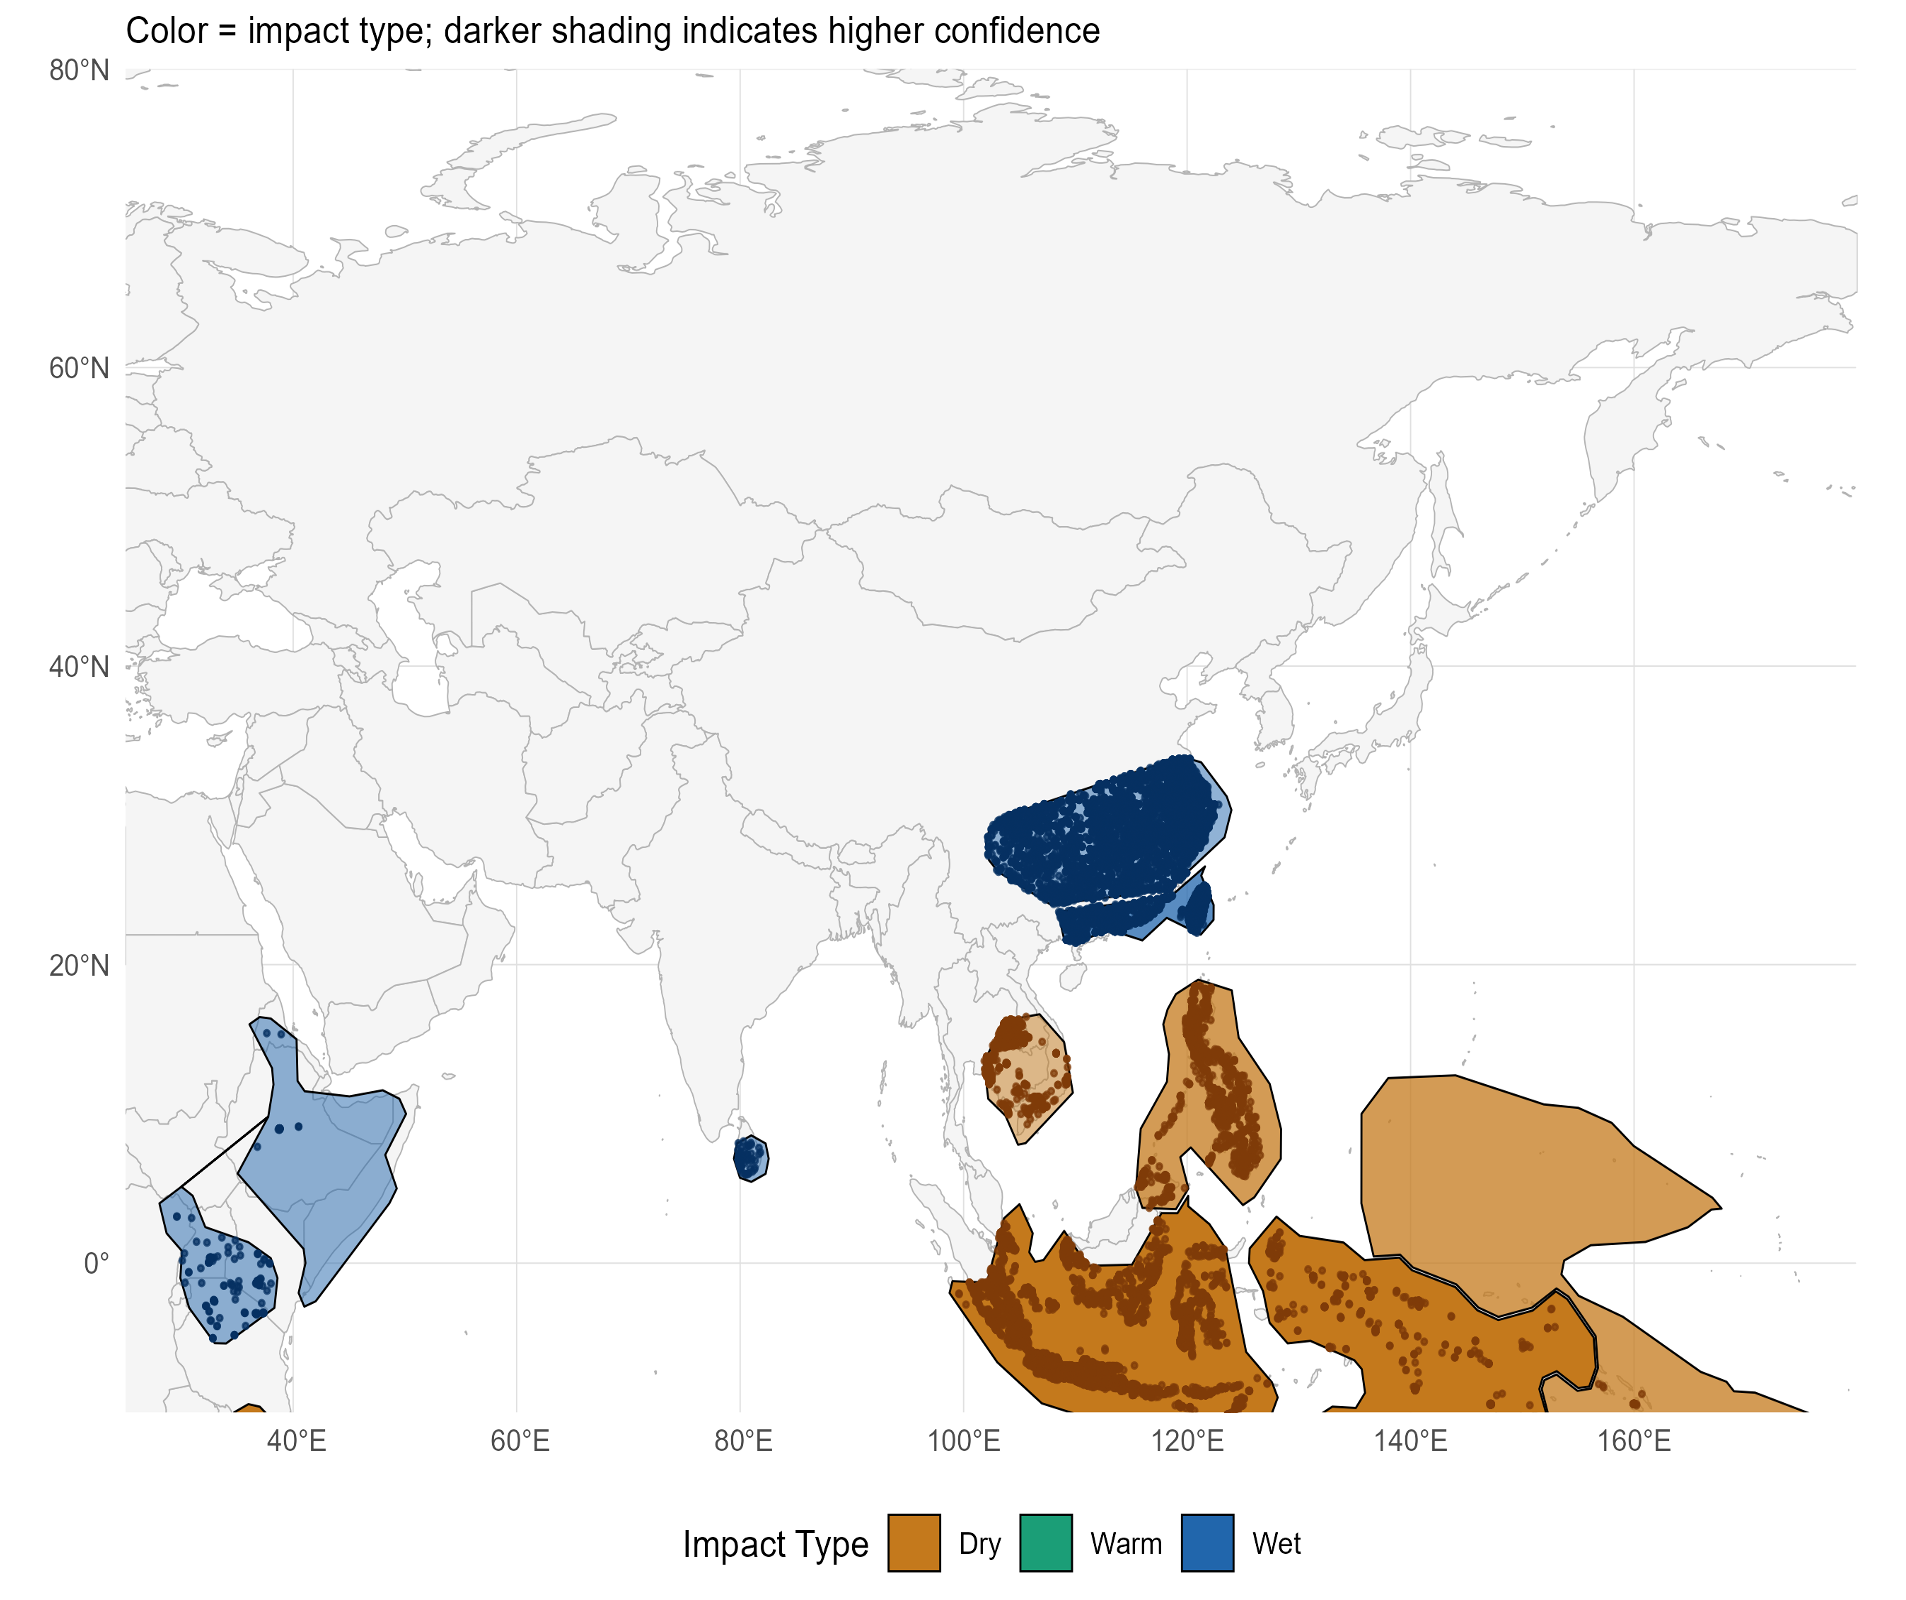
Figures 5-6 summarize the geolocated asset information, showing that the affected regions with the most identified corporate assets are the US Gulf Coast & Southeast, Southern California/US Southwest/Northern Mexico, and Southern China, which are all anticipated to be wet. By jurisdictions, the United States, China, Taiwan, and Indonesia have the most exposed assets.
Figure 5: Top 10 Affected Regions, by Number of Assets
| Region | Impact | Confidence | Assets (‘000) |
| US Gulf Coast & Southeast | Wet | High | 133.1 |
| Southern California, US Southwest, & Northern Mexico | Wet | Medium-high | 49.8 |
| Southern China | Wet | Medium-high | 24.2 |
| Yangtze Basin | Wet | Medium | 23.4 |
| Indonesia & Maritime Continent | Dry | High | 17.5 |
| Southeast South America | Wet | High | 11.0 |
| Philippines | Dry | Medium-high | 9.9 |
| Southern Africa | Dry | High | 9.1 |
| Northern California | Wet | Medium | 7.8 |
| Interior British Columbia, Northern Rockies & Inland Northwest | Dry | Medium | 6.2 |
Source: ISS STOXX Geospatial Asset database; El Niño 2026-27 Impact Dashboard
Figure 6: Top 10 Affected Jurisdictions, by Number of Assets
| Country | Assets (‘000) |
| USA | 191.9 |
| China | 28.9 |
| Taiwan | 16.5 |
| Indonesia | 14.2 |
| Brazil | 13.5 |
| Philippines | 9.6 |
| South Africa | 8.6 |
| Canada | 4.7 |
| Colombia | 2.8 |
| Singapore | 2.6 |
Source: ISS STOXX Geospatial Asset database; El Niño 2026-27 Impact Dashboard
To illustrate in greater detail, Figures 7 and 8 zoom into North American and Asian exposed assets.
Figure 7: STOXX AC World Exposed Assets: North America
Source: ISS STOXX Geospatial Asset Database; El Niño 2026-27 Impact Dashboard
Figure 8: STOXX AC World Exposed Assets: Asia
Source: ISS STOXX Geospatial Asset Database; El Niño 2026-27 Impact Dashboard
Exposed Issuers and Asset Types
The Geospatial Asset Database contains metadata that may help investors better understand their specific portfolio exposures based on the type of asset. There are currently 30 types of assets, including an “other” category for unclassified assets. As shown in Figure 9, services, stores, and offices are among the most commonly affected assets. However, other key assets such as plants, mines, data centers, or hydropower may warrant greater scrutiny.
Figure 9: Most Commonly Affected Asset Types
| Asset Type | Assets (‘000) |
| Services | 67.0 |
| Store | 65.1 |
| Office | 30.3 |
| Plant | 9.1 |
| Real Estate | 8.0 |
| Storage | 2.9 |
| Distribution Center | 2.7 |
| R&D | 0.4 |
| Terminal | 0.4 |
| Renewable Solar Farm | 0.4 |
| Mine | 0.3 |
| Renewable Wind Farm | 0.2 |
| Data Center | 0.2 |
| Renewable Hydropower | 0.2 |
| Other | 118.9 |
Source: ISS STOXX Geospatial Asset database; El Niño 2026-27 Impact Dashboard
There is also more granular product metadata, encompassing up to ~2000 product categories. This metadata helps to better assess the materiality of assets: for example, bank ATMs versus offices. By using the product metadata, the “Other” category can also be identified to be in categories such as cell towers or ATMs.
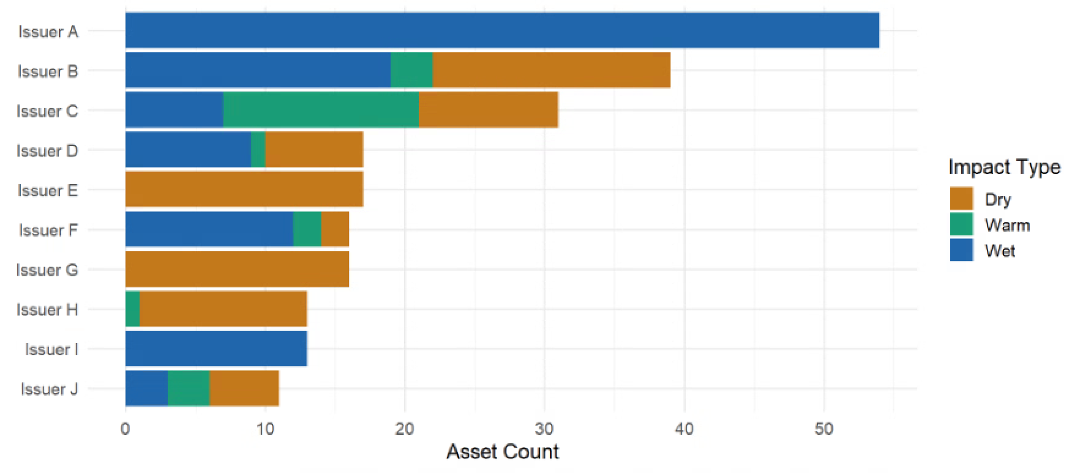
Drilling deeper, an investor interested, for example, in mines potentially exposed to adverse El Niño conditions may assess every issuer in their portfolio, ranking the number of mines exposed to each weather condition. This approach is shown anonymized in Figure 10. Using the product metadata, analysts can distinguish among types of mines such copper, coal, iron ore, gold, etc.
Figure 10: Top 10 Issuers by Exposed Mine Assets
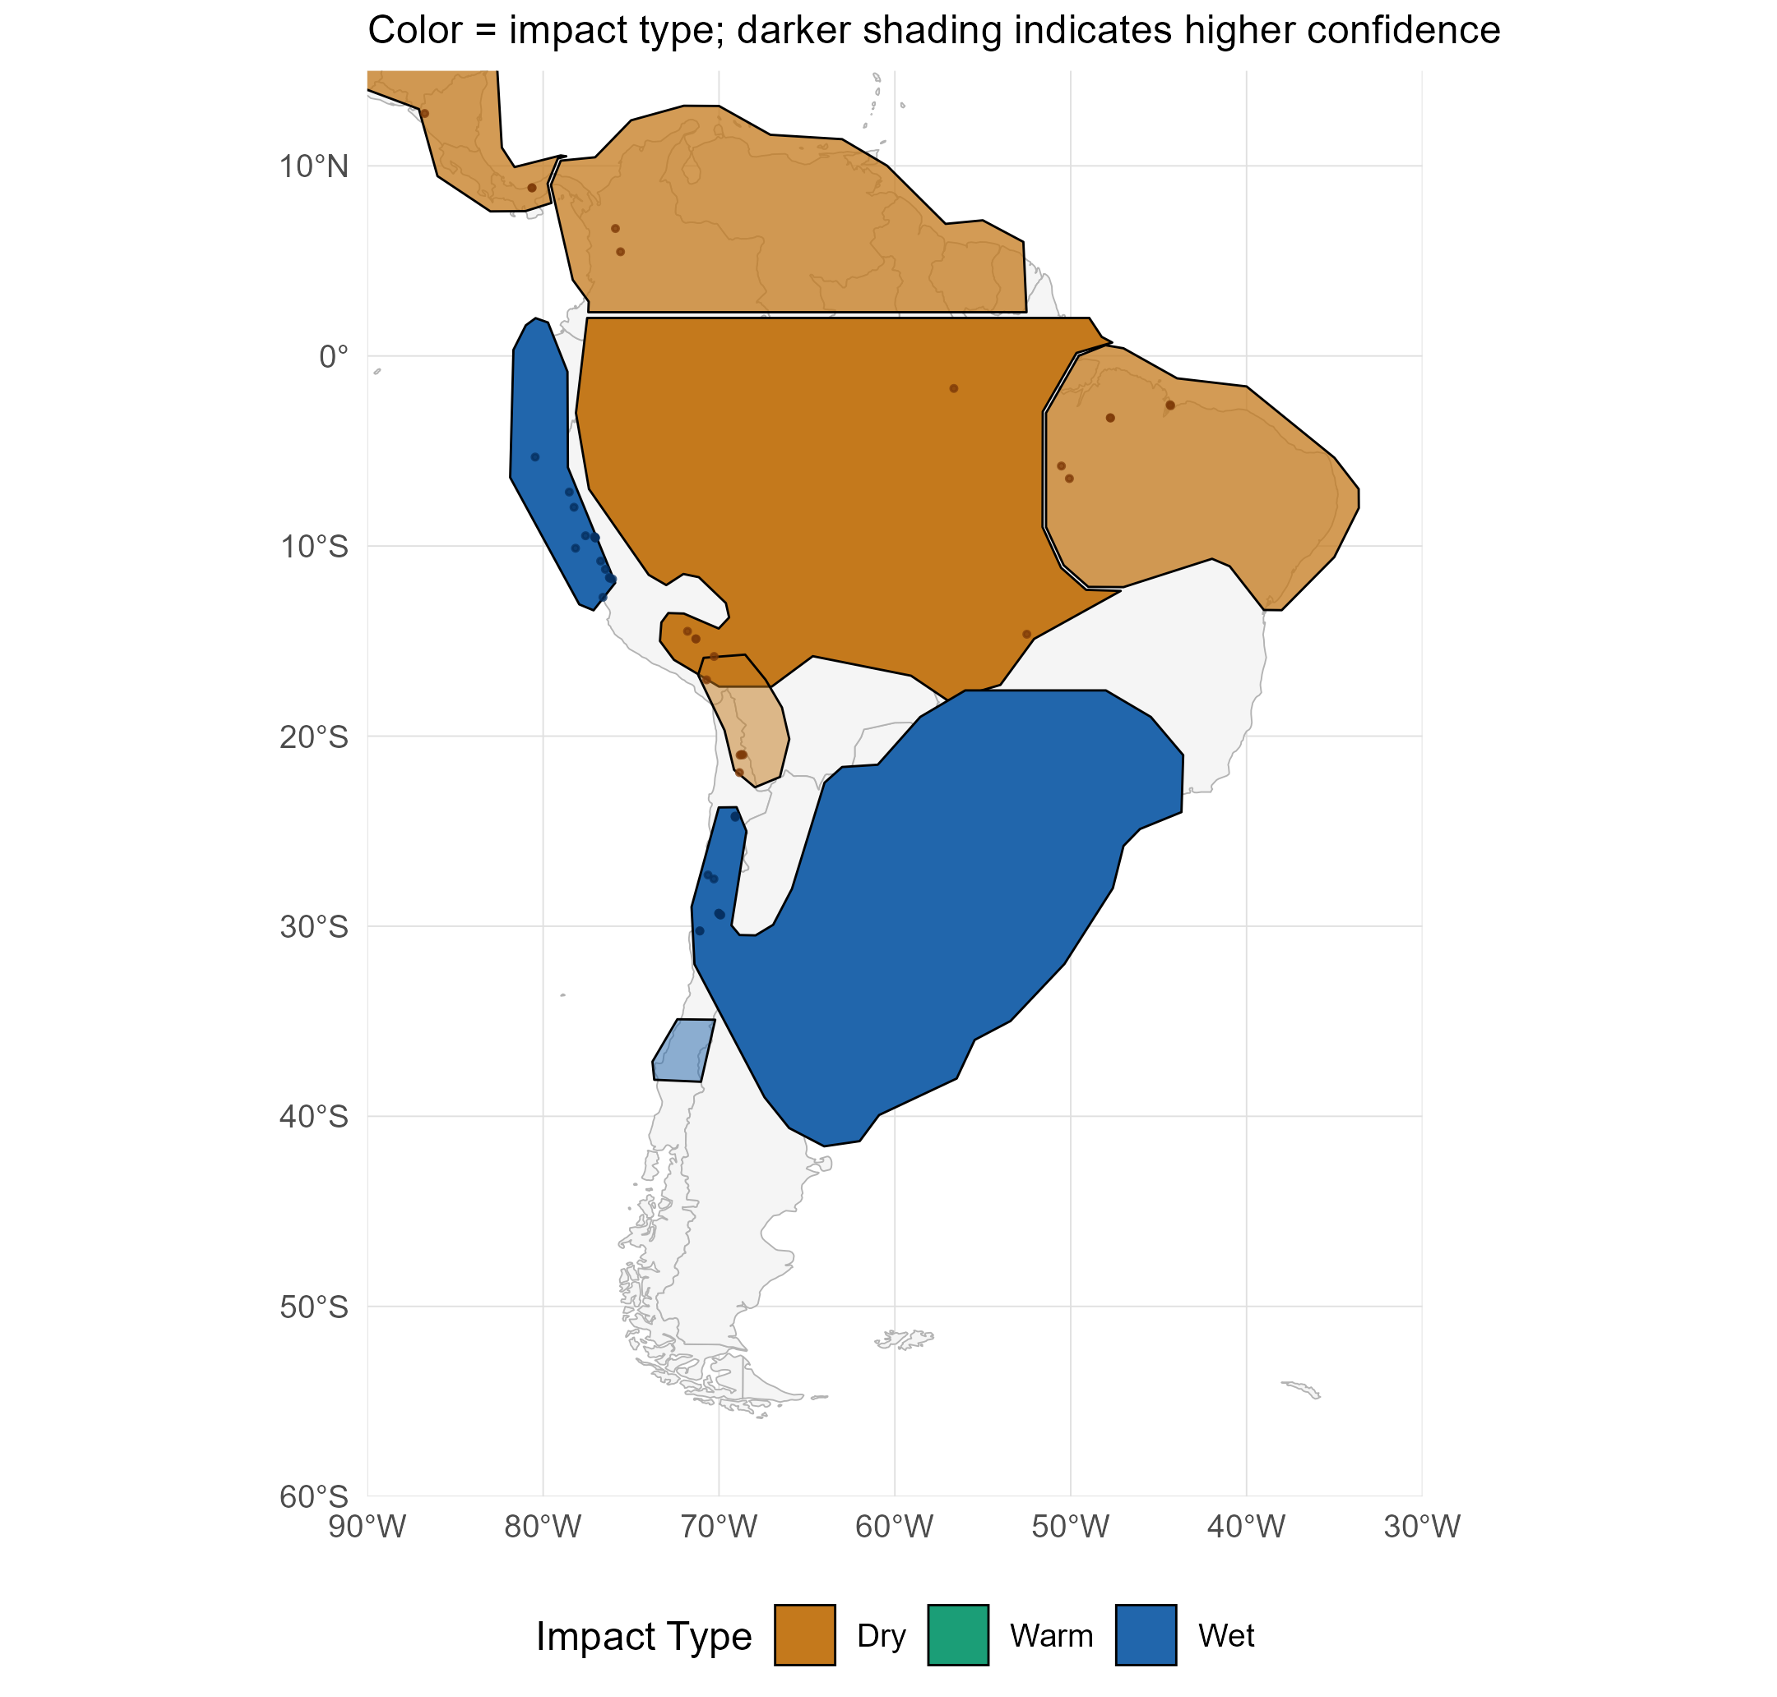
The individual mines can also be geolocated, as in Figure 11. Geolocation illustrates the mining exposure in the “wet” Peruvian region and “dry” Northeastern Brazil.
Figure 11: STOXX AC World Exposed Mines: South America
Source: ISS STOXX Geospatial Asset Database; El Niño 2026-27 Impact Dashboard
GAD: A Starting Point for El Niño Exposure Analysis
Scientists at major national weather services anticipate that the current El Niño could be the strongest in decades and perhaps set new records. From a meteorological ocean temperature perspective, the effect should peak during the coming Boreal winter 2026. However, the societal (and potentially corporate) impacts may continue to intensify into the spring and summer of 2027, leading to potential physical hazards and effects on agriculture, energy, mining, transportation, and industry. The U.N. has warned of an acute threat of hunger for nearly 50 million people.
For most investors, this potentially unprecedented weather event falls outside their standard analytic toolbox. By leveraging geospatial data, investors may take initial steps to better understand their investments’ exposure and potential vulnerabilities to El Niño.
Your Feedback Matters
Let us know how this research resonated with you. Your input helps us develop content that resonates with investors across the globe.

Authored By
Hernando Cortina, CFA, ISS STOXX
See More