The Ocean as a Pharmacy: A Circularity Assessment of the Pharmaceuticals & Biotechnology Industry

The ocean is celebrated across the globe on World Oceans Day, June 8th. Covering more than 70% of the earth’s surface, the ocean plays many essential roles such as climate regulation, providing resources, and maintaining life on Earth. As industries increasingly rely on the marine environment, pollution poses a significant risk, threatening not only the health of oceans but the very foundation of marine discovery and innovation.
The pharmaceuticals and biotechnology industry has maintained a vital dependence on marine ecosystems for decades, drawing life-saving compounds from the ocean’s biodiversity to address diseases such as malaria and cancer. This relationship represents both an opportunity and a risk for pharmaceutical companies. While marine environments continue to fuel pharmaceutical innovation, the industry could experience negative long-term consequences if its production processes return harmful compounds to the very ecosystems from which they originate.
The following analysis explores the pharmaceutical-ocean relationship through the lens of water circularity, leveraging the Circular Transition Indicator (CTI) framework. Developed by the World Business Council for Sustainable Development (WBCSD), the framework was launched in 2020. Since then, it has been updated with the objective of helping companies understand their impact and increase circularity across their value chains.
This analysis uses the CTI framework to assess companies, with a focus solely on water, against two pillars of the framework known as “Close the Loop” and “Enhance the Loop.” By using ISS STOXX data and evaluating 561 public companies in the pharmaceuticals and biotechnology industry, this post explores companies’ behavior towards specific indicators related to wastewater and freshwater. The objective is to understand companies’ approaches in these areas and explore the connections among water use, circularity, and potential undesired effects on the marine environment.
Close the Loop: Reducing Wastewater
The first pillar of the CTI framework, Close the Loop, evaluates how well companies keep materials, water, and energy circulating within the system, instead of becoming waste.
Table 1 illustrates the correlation between the CTI indicator related to water circularity and the ISS STOXX proxy indicator. “Proxy indicators” refer to alternative indicators used in place of CTI metrics and applied to portfolio analysis.
Table 1: CTI and Proxy Indicators for Reducing Wastewater
| CTI Indicator | % Water Circularity |
| Proxy Indicator | Elimination of Active Pharmaceutical Ingredients (API) from Production Wastewater |
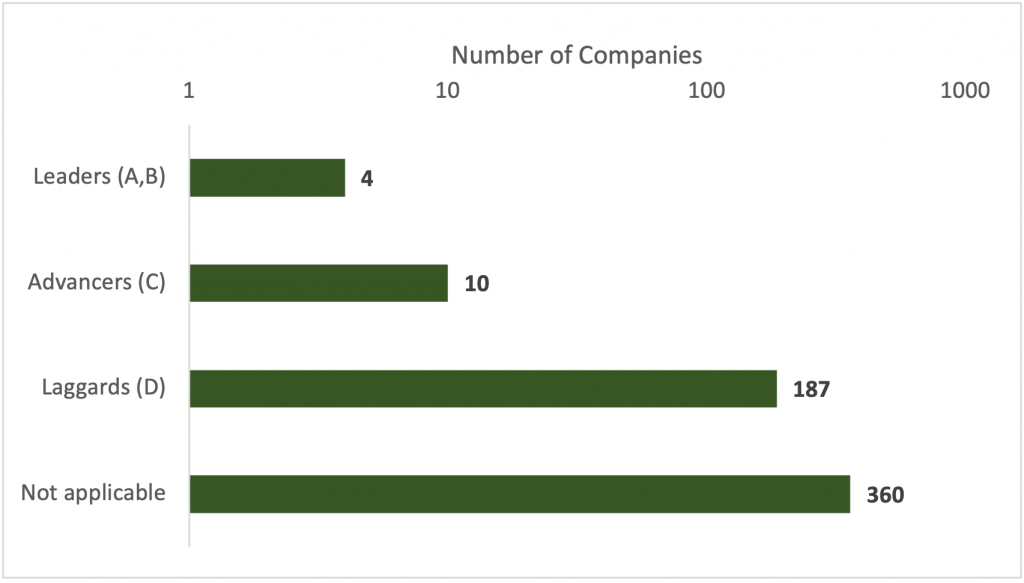
Figure 1: Elimination of API from Production Wastewater
Source: ISS ESG Corporate Rating, Elimination of API from Production Wastewater Indicator, May 2025
Among the 561 pharmaceutical companies evaluated, 360 companies were classified as “not applicable” for the API environmental risk indicator due to their distinct business models that either do not involve manufacturing operations or work with compounds that have negligible environmental impact.
Of the remaining 201 companies, only 2% are classified as leaders. To be classified as such, companies need to use technologies to reduce API exposure, while disclosing the impact and quality of treatment measures.
Another 5% of companies in the universe are classified as advancers, meaning they have some treatment measures in place; however, they do not meet all the requirements to be classified as leaders. The vast majority—187 companies, representing 93% of those evaluated—fall into the laggards category.
This stark performance distribution, with 93% of applicable companies in the laggard category, indicates that, despite growing regulatory attention and scientific evidence of environmental impacts, adequate management of pharmaceutical waste streams remains a significant gap in the industry. Further, the stark performance distribution suggests significant unaddressed risk across the sector but also potential competitive advantage for leaders. The leading companies demonstrate that technology solutions exist—advanced oxidation processes, membrane filtration, and activated carbon treatments can achieve removal rates exceeding 95% for most pharmaceutical compounds—yet these approaches have not been widely implemented.
Companies with advanced wastewater treatment capabilities may be better positioned for market access amid increasing concern that procurement policies should incorporate environmental criteria. Investors may also note the potential risk concentration in companies with significant manufacturing or supplier operations in regions combining high pharmaceutical production volumes with less stringent environmental enforcement. These operational geographies may represent material risk factors requiring enhanced due diligence and engagement.
Optimize the Loop: Using Water Efficiently
The second pillar of the CTI framework, Optimize the Loop, focuses on enhancing resource efficiency and reducing reliance on critical and scarce materials.
Table 2 below illustrates the correlation between the CTI indicator related to water circularity and the ISS STOXX proxy indicator.
Table 2: CTI and Proxy Indicators for Water Use Efficiency
| CTI Indicator | % Recovery Type Actual Lifetime Onsite Water Circulation |
| Proxy Indicator | Freshwater Intensity |
Pharmaceutical manufacturing ranks among the most water-intensive industrial sectors due to stringent quality requirements, extensive cleaning protocols between production batches, and cooling needs. This high dependence on a stable water supply creates significant business risks, particularly as many pharmaceutical manufacturing facilities operate in water-stressed regions, and highlights the strategic importance of optimizing water use efficiency through circular approaches.
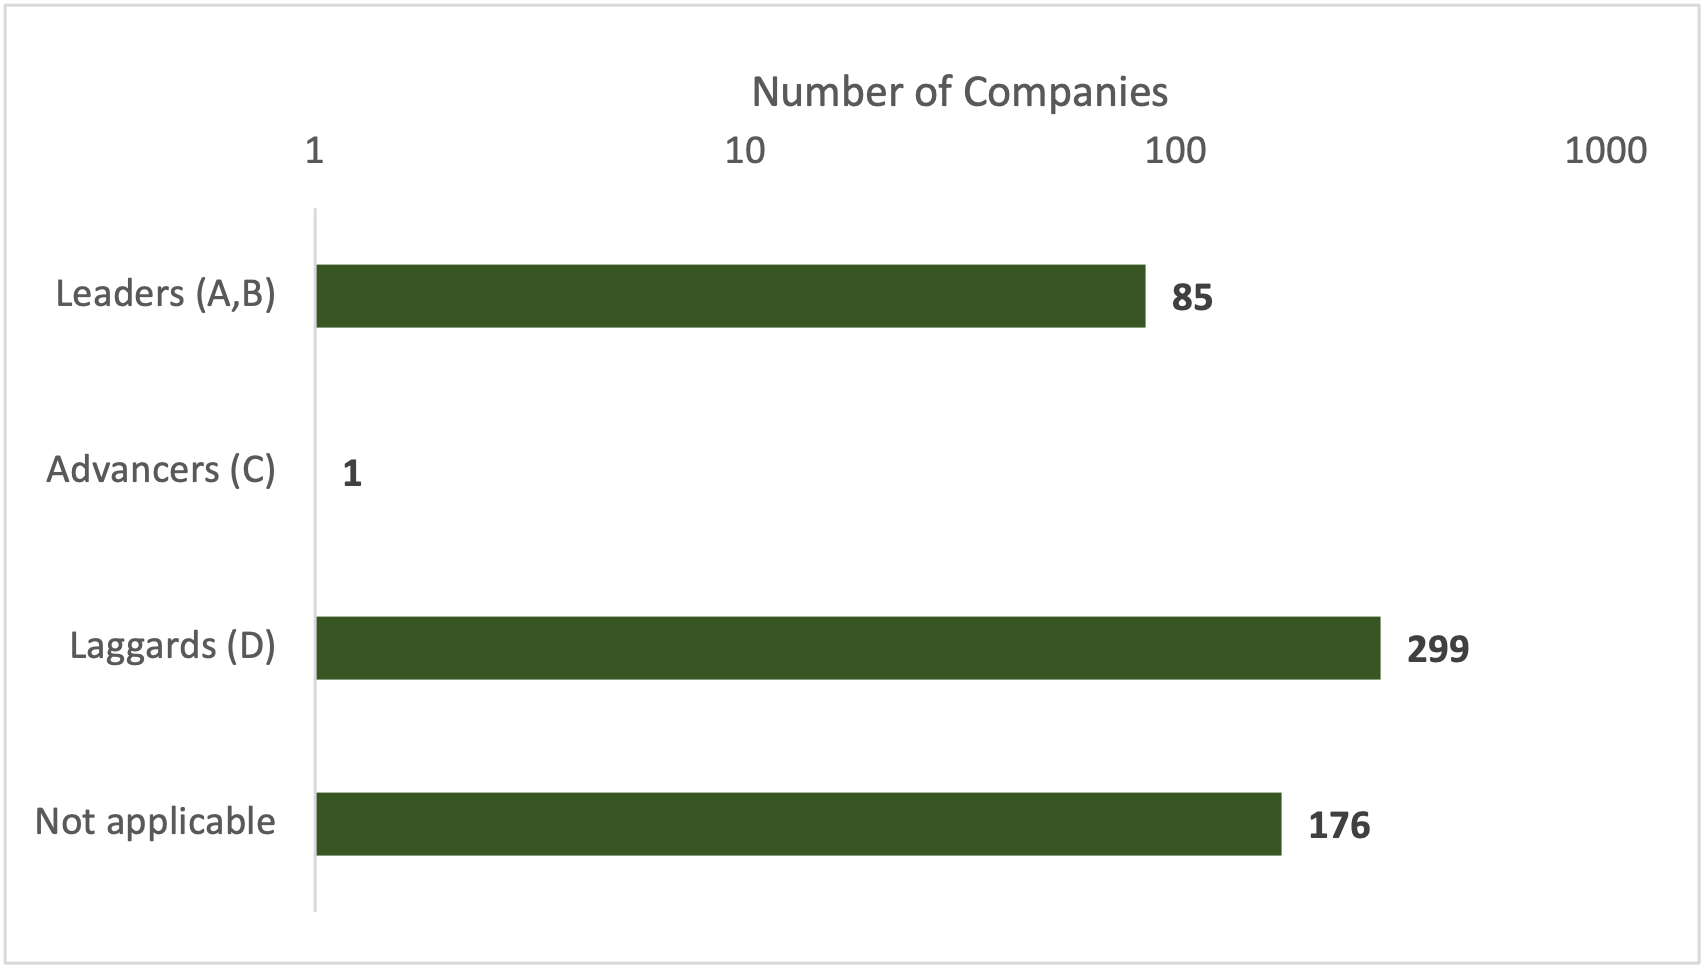
Optimizing water use efficiency can ensure both operational resilience and environmental sustainability. The Freshwater Intensity indicator (Figure 2) assesses companies’ behavior towards water efficiency and their efforts to reduce water usage and dependency.
Figure 2: Freshwater Intensity
Source: ISS ESG Corporate Rating, Freshwater Intensity, May 2025
The pharmaceutical industry exhibits a sharply polarized water management performance distribution, with companies clustered predominantly as leaders or laggards, revealing a significant gap in efficient water management practices. This distribution pattern presents both material risks and strategic opportunities for investors.
The substantial concentration of laggards indicates that most pharmaceutical companies remain at the early stages of water efficiency practices, with significant unaddressed water-related operational risks. However, the presence of leaders indicates that effective water management solutions are being applied and can be scaled.
From a risk perspective, companies with higher intensity of freshwater use face greater vulnerability to physical water risks, including supply disruptions and increasing operational costs in water-stressed regions. This risk exposure is particularly acute for pharmaceutical manufacturing hubs concentrated in high water-risk areas.
Companies operating in these regions without sophisticated water management approaches represent elevated risk profiles. In contrast, those demonstrating lower freshwater intensity are positioned for greater operational resilience and potentially lower costs as water pricing reforms and withdrawal limits expand globally.
Conclusion
This analysis explored the pharmaceutical-ocean relationship through the lens of water circularity. Leveraging the Circular Transition Indicator (CTI) framework and assessing companies on the two proposed proxy indicators leads to the following conclusions:
- The Elimination of API from Production Wastewater indicator represents a critical aspect of water circularity.
- The Freshwater Intensity indicator shows how companies with higher freshwater intensity patterns face a variety of risks, in contrast to companies with better water management practices. As circularity reinforces the concept of resource efficiency, companies that perform well on freshwater intensity are most likely to reduce their dependency on water while improving their process efficiency.
As industries rely on nature, investors can benefit from understanding their portfolio companies’ impacts and dependencies on natural resources.
Explore ISS STOXX solutions mentioned in this report
- Identify ESG risks and seize investment opportunities with the ISS ESG Corporate Rating.
Authored By
Clarissa Persico, Freshwater and Oceans, Natural Capital Research Institute
Tessa Elliott Frei, Corporate Ratings, Pharmaceuticals & Biotechnology
See More