
Key Takeaways
- This article examines 2025 trends in sustainable funds using data from ISS MI MarketPulse. The analysis focuses on the global equity and fixed income fund categories, which totaled $59 trillion in AUM as of December 2025.
- Total AUM growth of sustainable funds accelerated to 17% in 2025, reaching $3.2 trillion, or approximately 5% of equity and fixed income AUM.
- Nonetheless, sustainable funds’ AUM lagged the overall market and experienced modest outflows of over 2% of AUM.
- Sustainable ETFs again grew a healthy 25%, which was nonetheless below the growth in conventional ETFs.
- Sustainable fixed income performed better, though, growing 24%, ahead of conventional fixed income’s 16% growth. Fixed income now represents a quarter of total sustainable fund assets.
The year 2025 presented a nuanced picture of sustainable funds. On the positive side, total AUM growth was high at 17% and accelerated compared with 2024’s 9% growth. Sustainable funds AUM reached a new high of $3.2 trillion. However, the sustainable growth rate slightly lagged the 19% growth in conventional funds. Furthermore, in aggregate, sustainable funds experienced modest outflows.
Two notable positive trends within the sustainable funds market were the growth of fixed income and ETFs. First, sustainable fixed income growth of 24% outpaced conventional fixed income’s 16% growth. Fixed income now represents a quarter of total sustainable fund assets. Second, sustainable ETFs continued to experience rapid AUM growth of over 25%, yet are still somewhat below conventional ETF’s 32% growth.
The distinction between sustainable and conventional funds relies upon the Morningstar classification available on ISS Market Intelligence’s MarketPulse. “Unclassified” funds are included within the conventional category. Going by this definition, there are $56 trillion in conventional funds and ETFs, while $3.2 trillion are in sustainable funds and ETFs, as shown in Table 1. Drilling down, the majority of sustainable AUM, around 84%, is domiciled in Europe (including “International funds”).
Table 1: Mutual Fund and ETF AUM by Fund Type (Dec 2025, trillion $)
| Domicile | Conventional | Sustainable |
| All (equity and fixed income) | 56.0 | 3.2 |
| Fixed Income Only | 16.0 | 0.8 |
| Europe (equity and fixed income) | 11.5 | 2.7 |
| Fixed Income Only | 4.1 | 0.7 |
| North America (equity and fixed income) | 37.2 | 0.3 |
| Fixed Income Only | 8.8 | 0.1 |
Notwithstanding outflows, total sustainable fund AUM grew at a faster pace in 2025 than in 2024. Globally, sustainable funds grew 16.8%, with market appreciation more than offsetting modest outflows. In Europe, AUM increased by 18.3% in 2025, even as the region saw $54 billion of outflows (~ 2.3% of its end-of-2024 AUM). North America saw sustainable AUM rising 7.1% for the year: this trend reflects a combination of weaker relative performance and more pronounced outflows amounting to 6.7% of end-of-2024 AUM. These dynamics are summarized in Figures 1-2.
Figure 1: 2025 Sustainable and Conventional Funds AUM Growth: Equity and Fixed Income Mutual Funds and ETFs
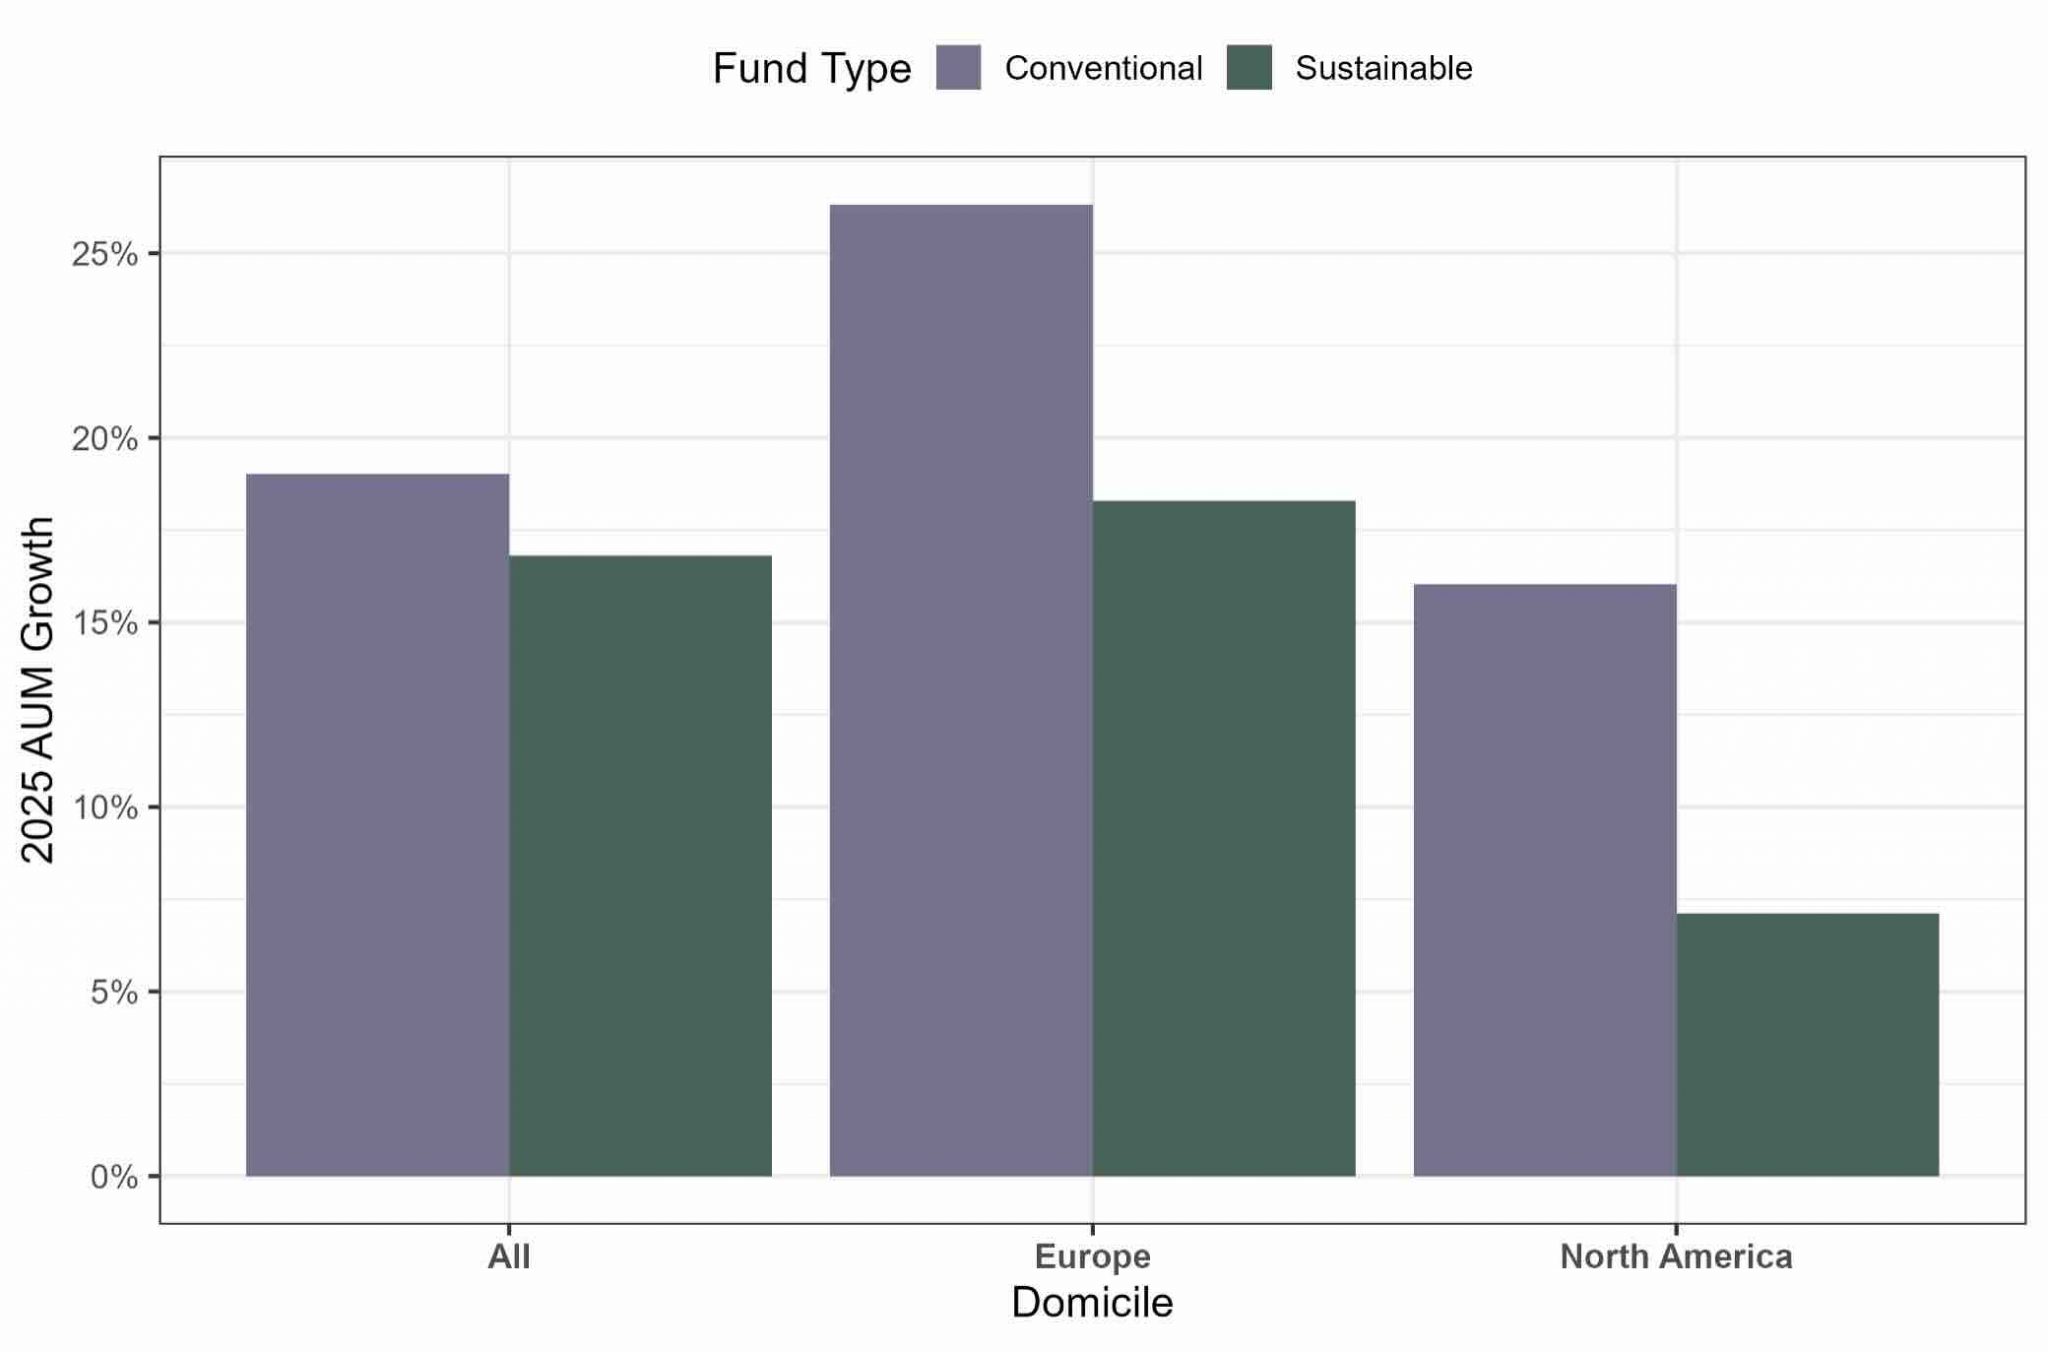
Figure 2: 2025 Sustainable and Conventional Net Flows: Equity and Fixed Income Mutual Funds and ETFs
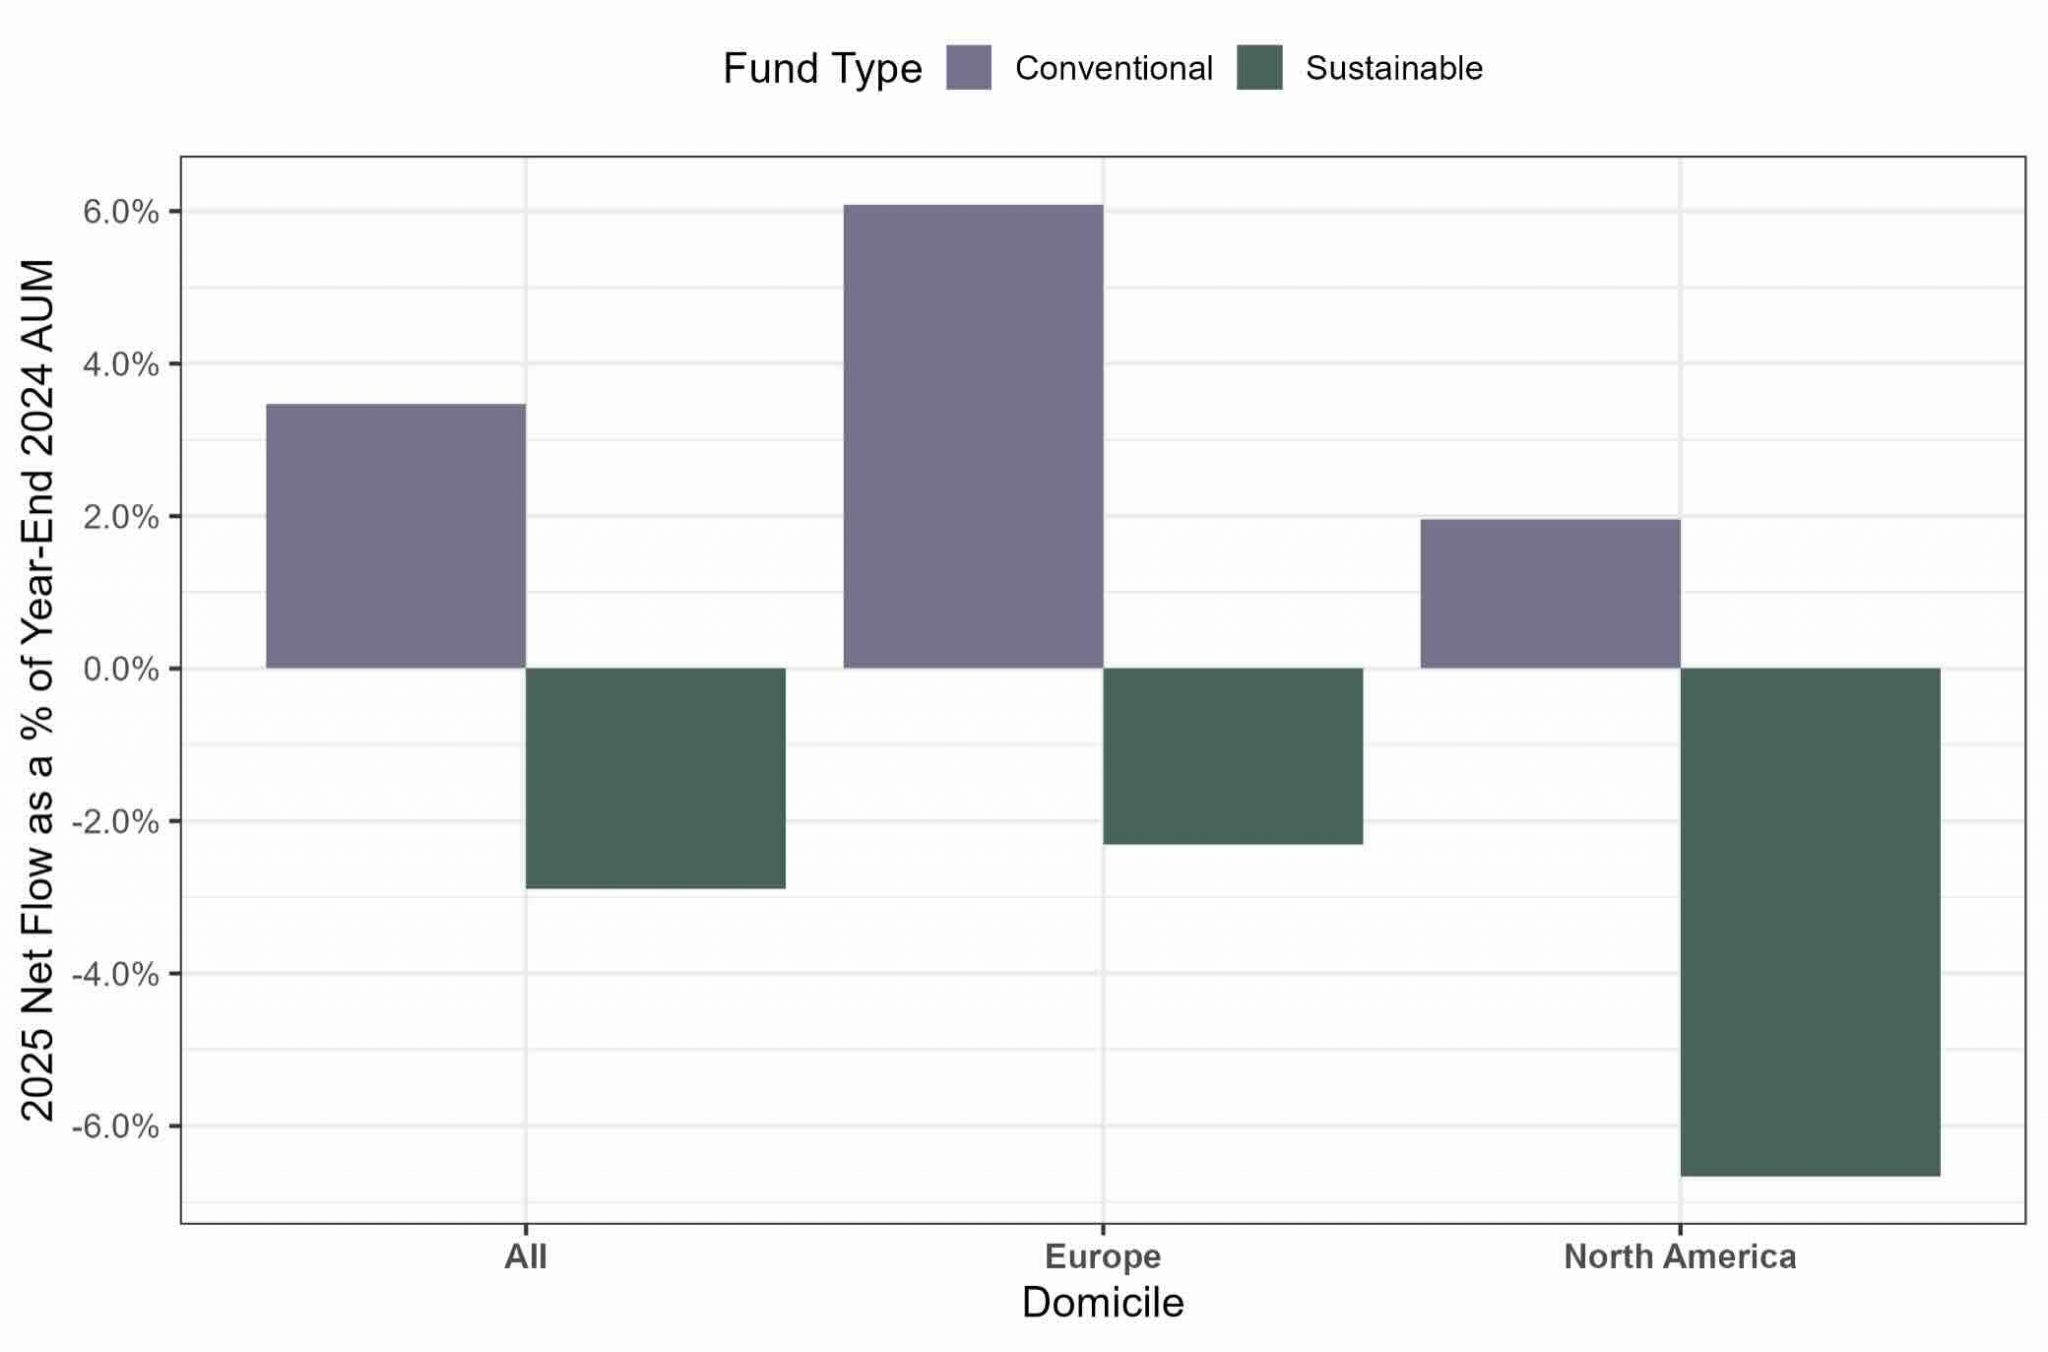
In contrast to 2024’s total net new inflow of $55 billion, every region except Australia experienced net sustainable fund redemptions in 2025, totaling $79 billion. Europe accounted for the largest share of outflows, with net redemptions of $54 billion, a sharp reversal from 2024’s $64 billion inflows. North America also recorded weakness, posting $21 billion in outflows for the year, greater than 2024’s 11 billion outflow.
Table 2 shows ETF AUM by region and fund type, highlighting $0.7 trillion in sustainable ETF assets and $17.4 trillion in conventional assets.
Table 2: ETF AUM by Fund Type (Dec 2025, trillion $)
| Domicile | Conventional | Sustainable |
| All (equity and fixed income) | 17.4 | 0.7 |
| Fixed Income Only | 3.1 | 0.1 |
| Europe (equity and fixed income) | 2.3 | 0.5 |
| Fixed Income Only | 0.5 | 0.1 |
| North America (equity and fixed income) | 12.9 | 0.1 |
| Fixed Income Only | 2.4 | 0.01 |
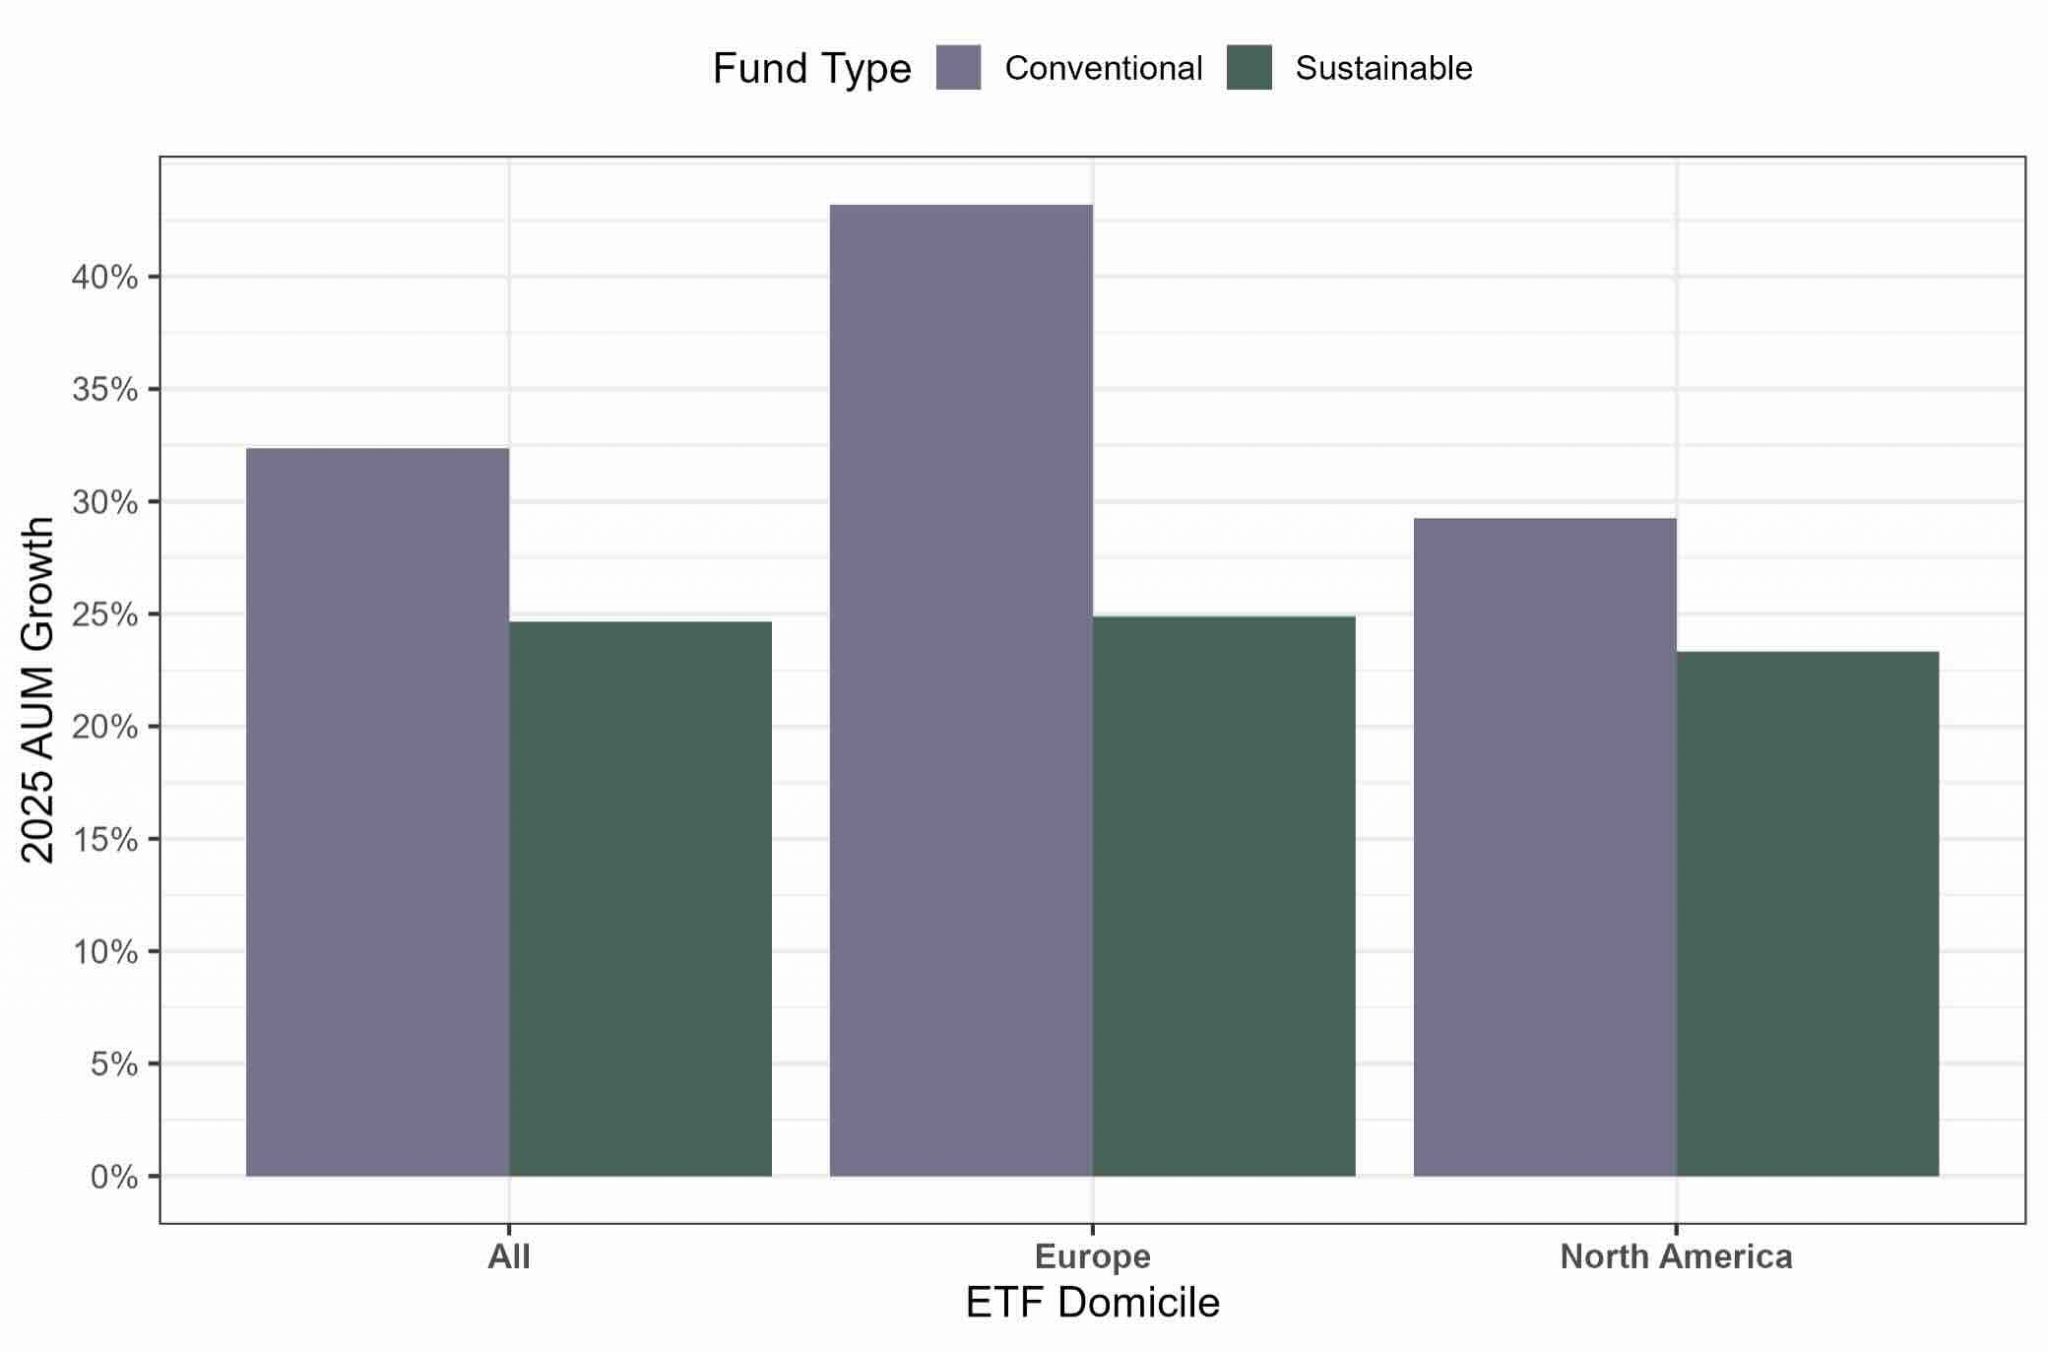
Figure 3 shows ETF AUM by fund category. The sustainable ETF category, which is 90% index-based, grew a healthy 24.6%, which was still below the growth in conventional ETFs. The growth of ETFs across global markets has been fueled most strongly by low-cost passive funds from large scale providers. Sustainable ETF assets in Europe and North America expanded by 24.9% and 23.3%, respectively, but still trailed the faster growth of their conventional peers.
Figure 3: 2024 Sustainable and Conventional ETF AUM Growth: Equity and Fixed Income ETFs
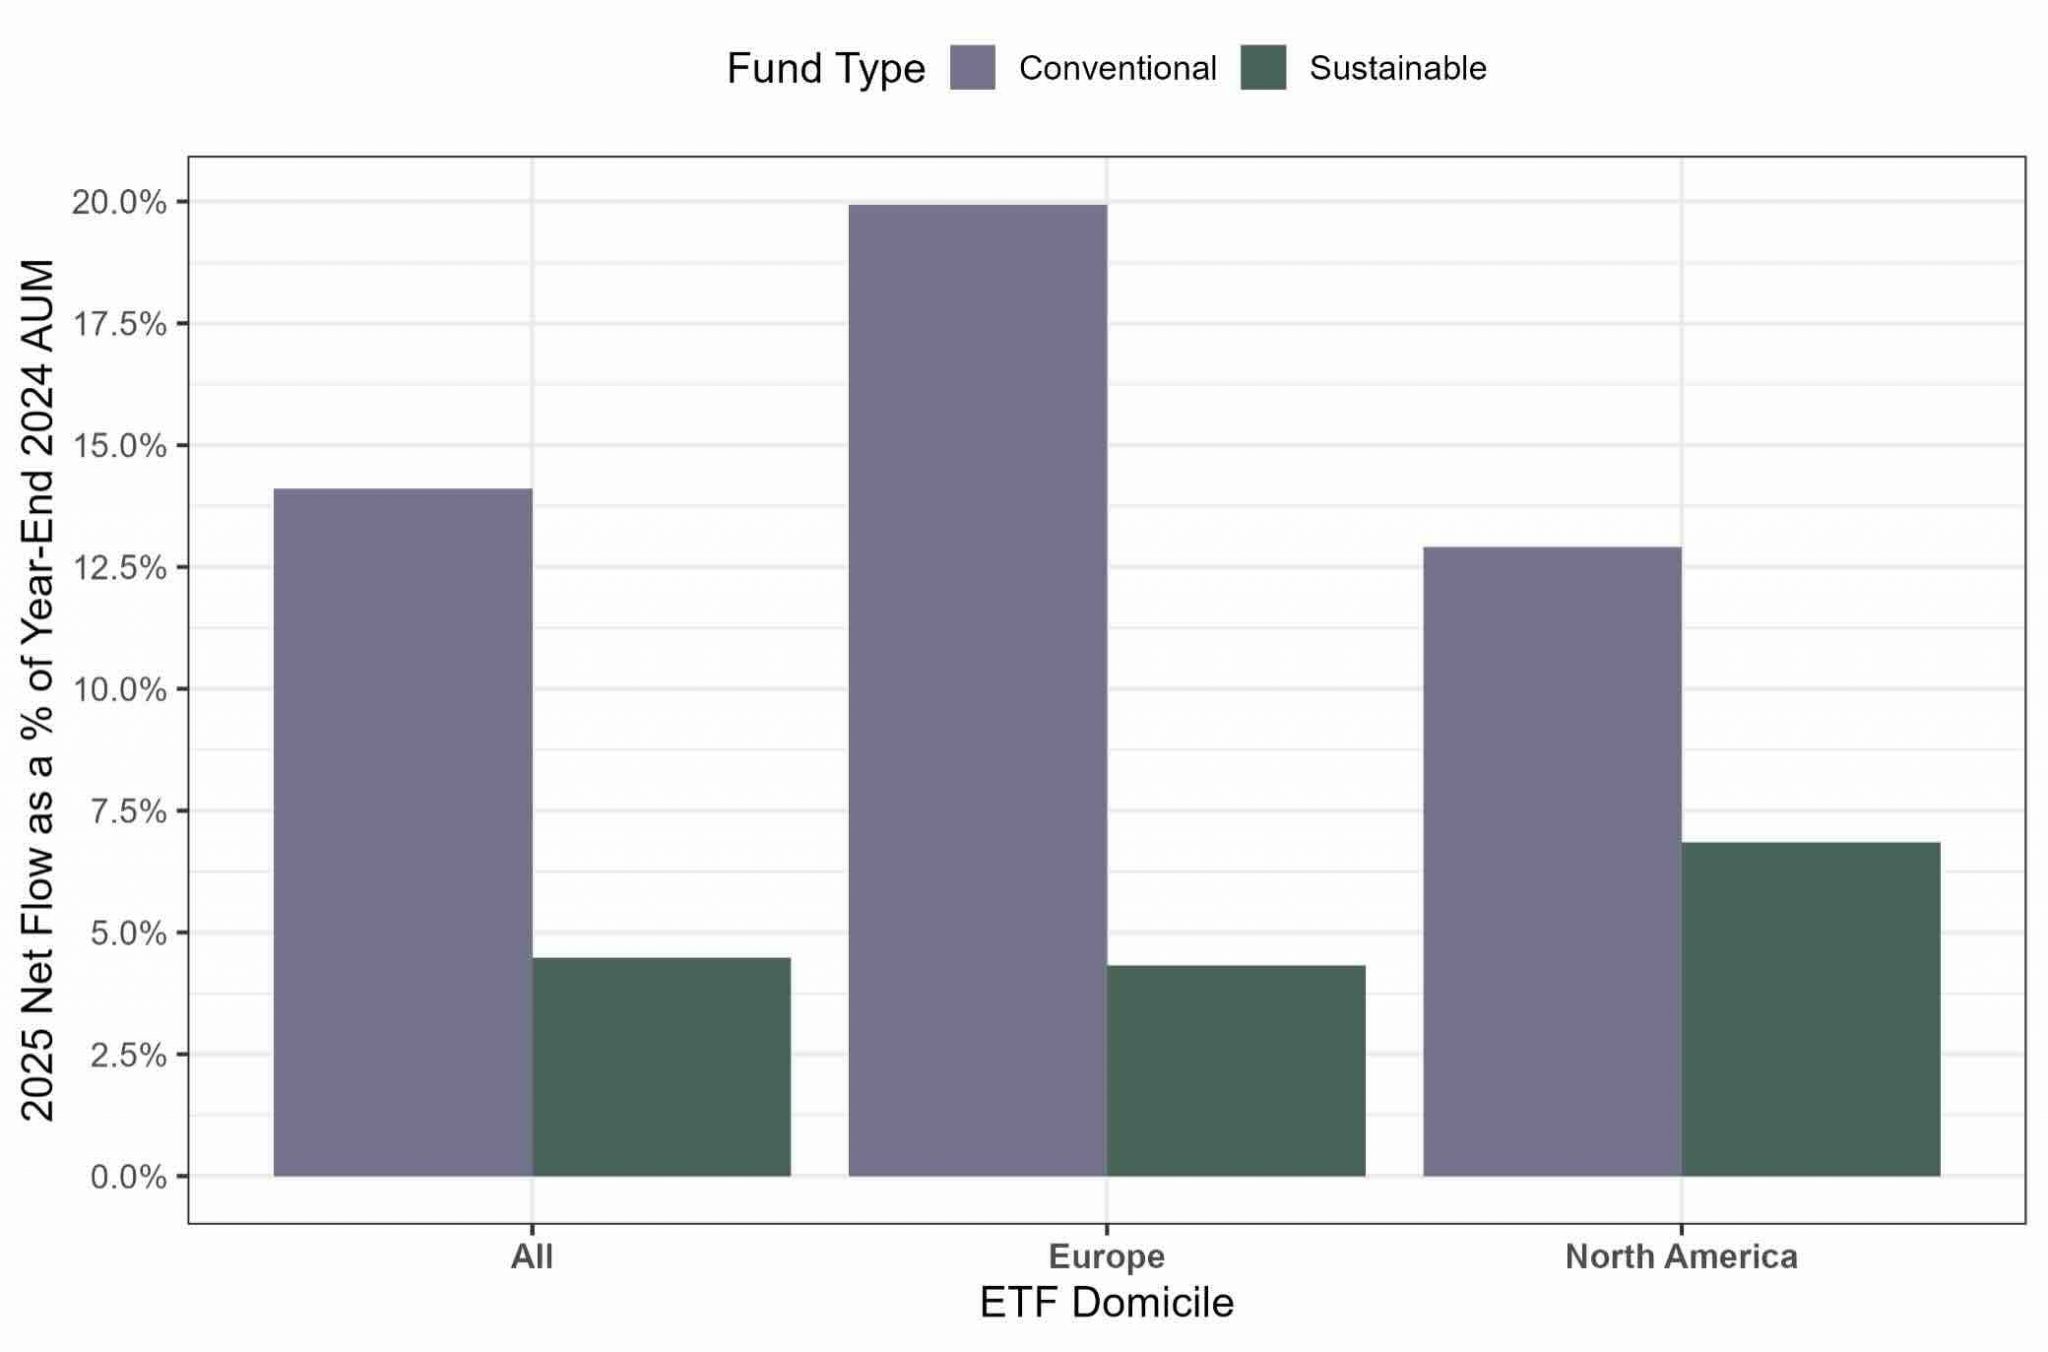
Sustainable ETFs attracted $24.1 billion in 2025, with the largest contributions coming from Europe ($18.7 billion) and North America ($4.9 billion).
When measured relative to 2024 year‑end AUM, sustainable ETFs’ net flows were 4.5% of assets, below the stronger growth for conventional ETFs (Figure 4).
Figure 4: 2025 Sustainable and Conventional ETF Net Flows: Equity and Fixed Income ETFs
In 2025, sustainable fixed‑income funds demonstrated notable resilience and outperformance relative to the broader bond fund market. At year-end, total sustainable fixed income assets amounted to $817 billion, or 25% of the total sustainable fund market. Globally, in 2025 they grew 23.7%, well ahead of the 16.4% expansion observed in conventional fixed‑income funds (Figure 5).
Figure 5: 2025 Sustainable and Conventional Funds AUM Growth: Fixed Income Mutual Funds and ETFs
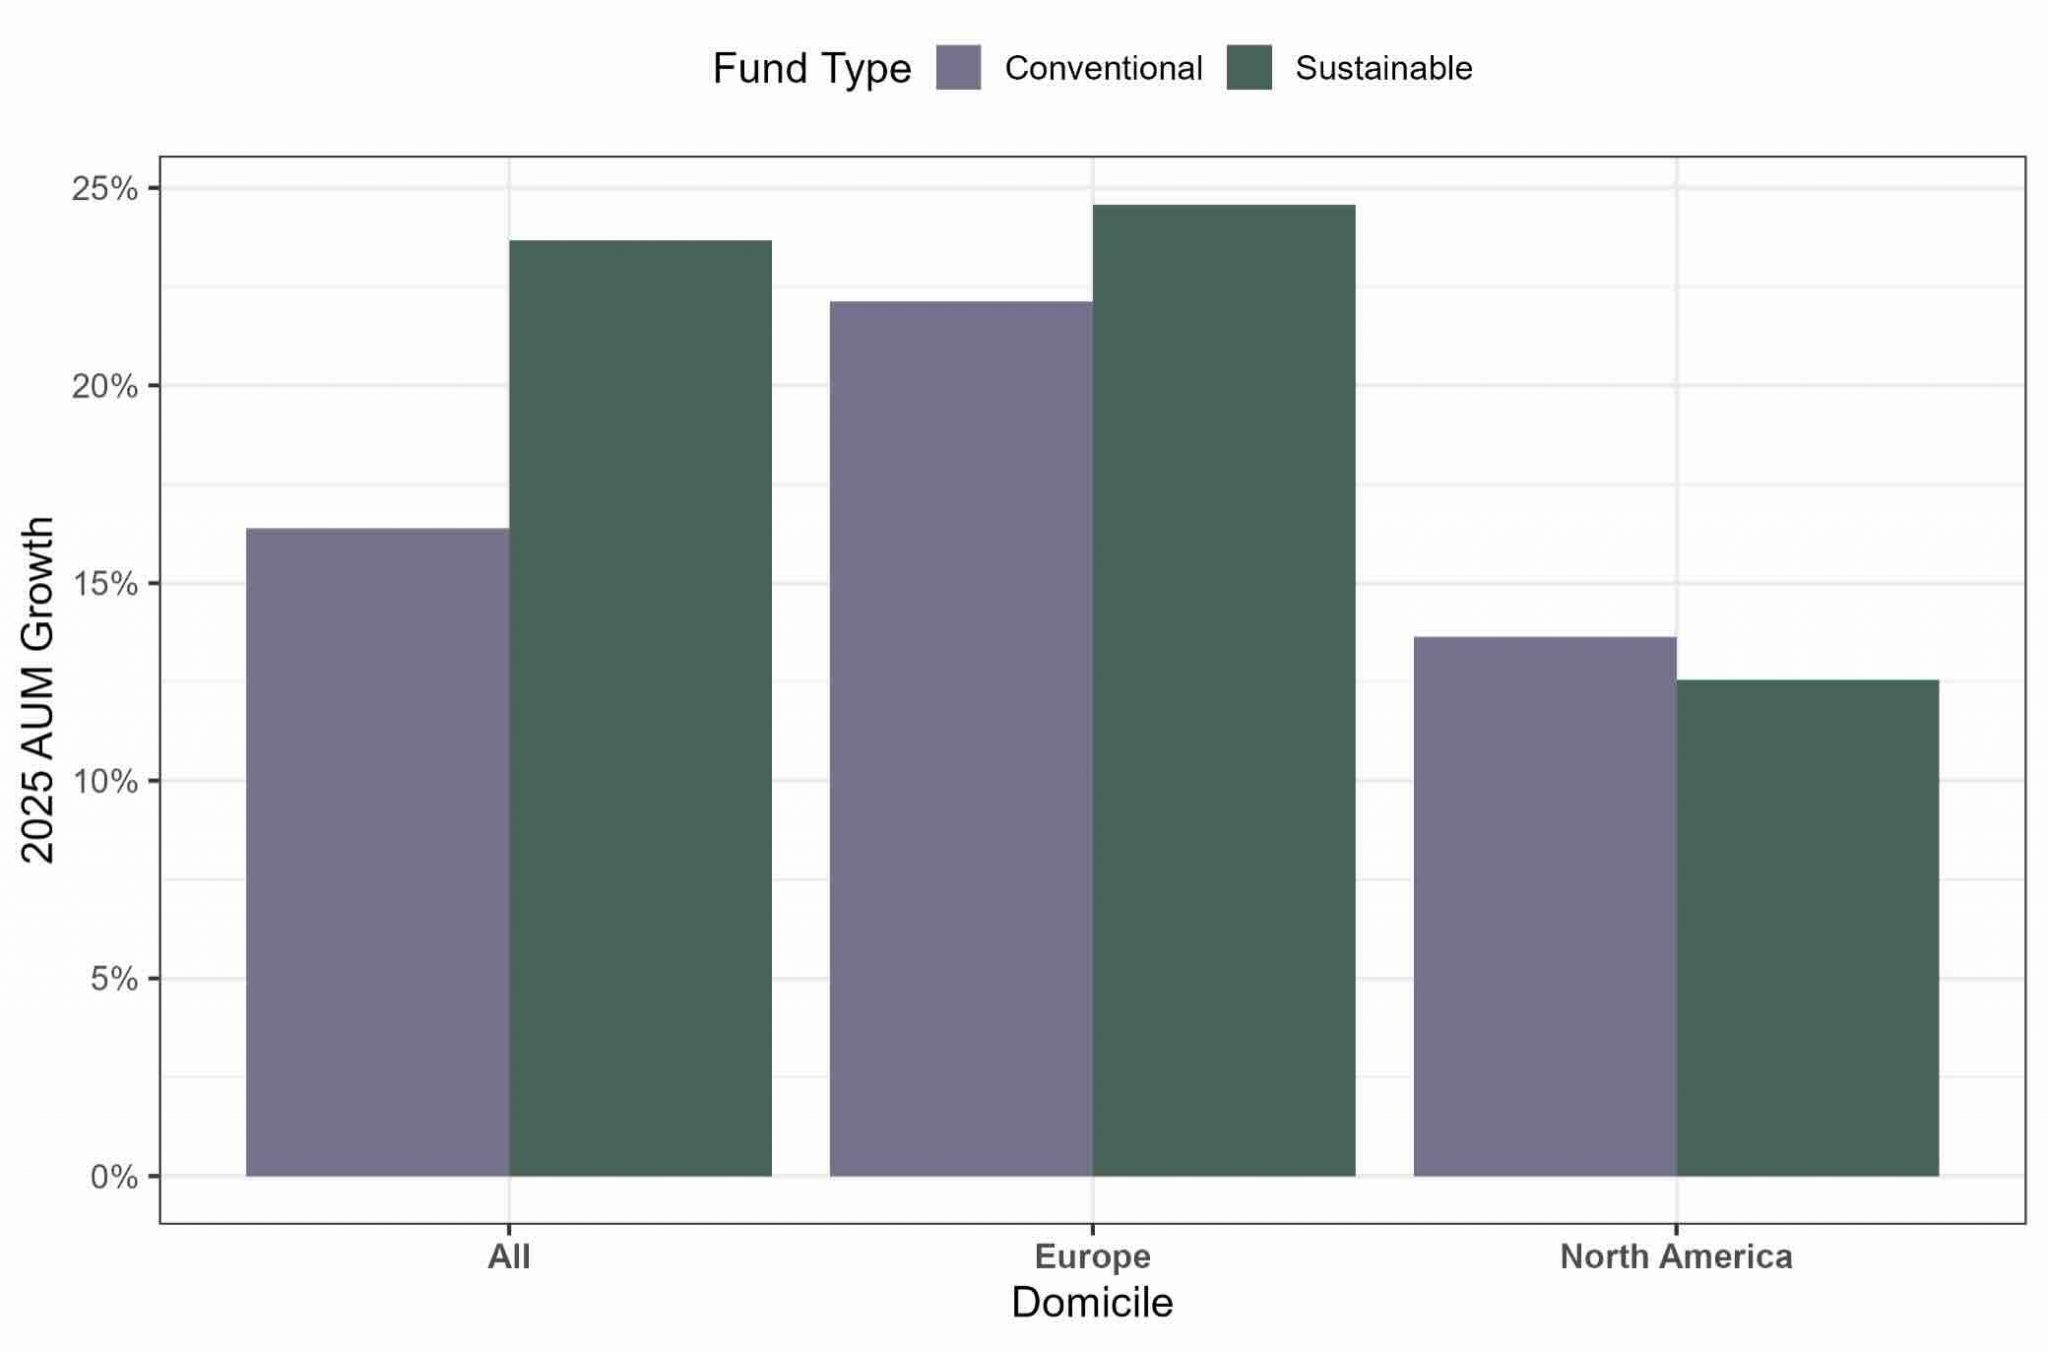
Regionally, sustainable fixed income assets in Europe grew by 24.6%, reflecting continued investor demand for sustainable and labeled debt.
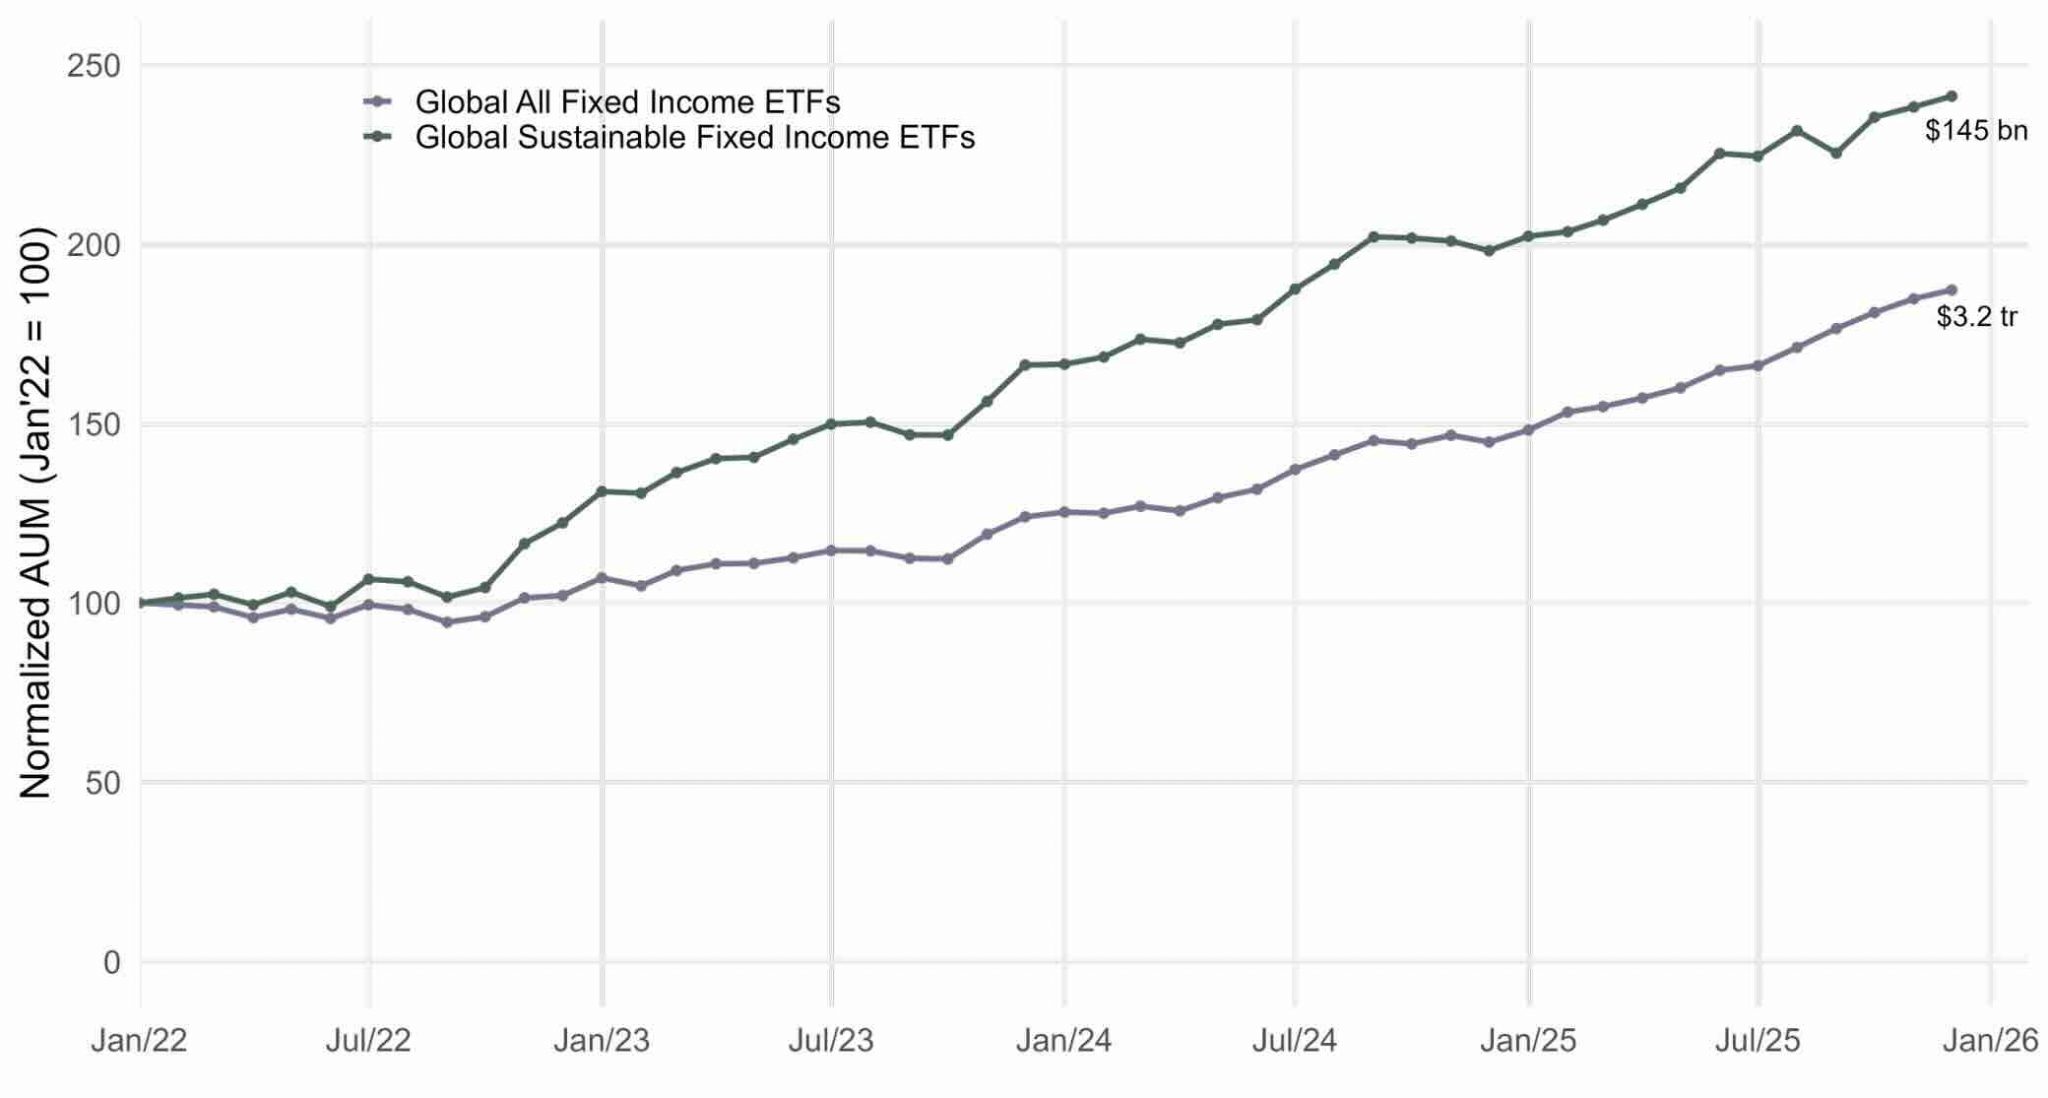
One continued bright spot for sustainable funds is that, over the past four years, AUM in sustainable fixed income ETFs has outpaced the fixed income ETF market with very rapid growth of 141%, ahead of the 87% growth for conventional fixed income ETFs. This is particularly impressive considering the heightened demand for and importance of bond funds, with aging demographics across developed markets driving persistent fixed income inflows. The sustainable fixed income ETF market stood at $60 billion at year-end 2021 and ended 2025 at $145 billion (Figure 6).
Figure 6: Fixed Income AUM Growth Rate: Sustainable vs All ETFs
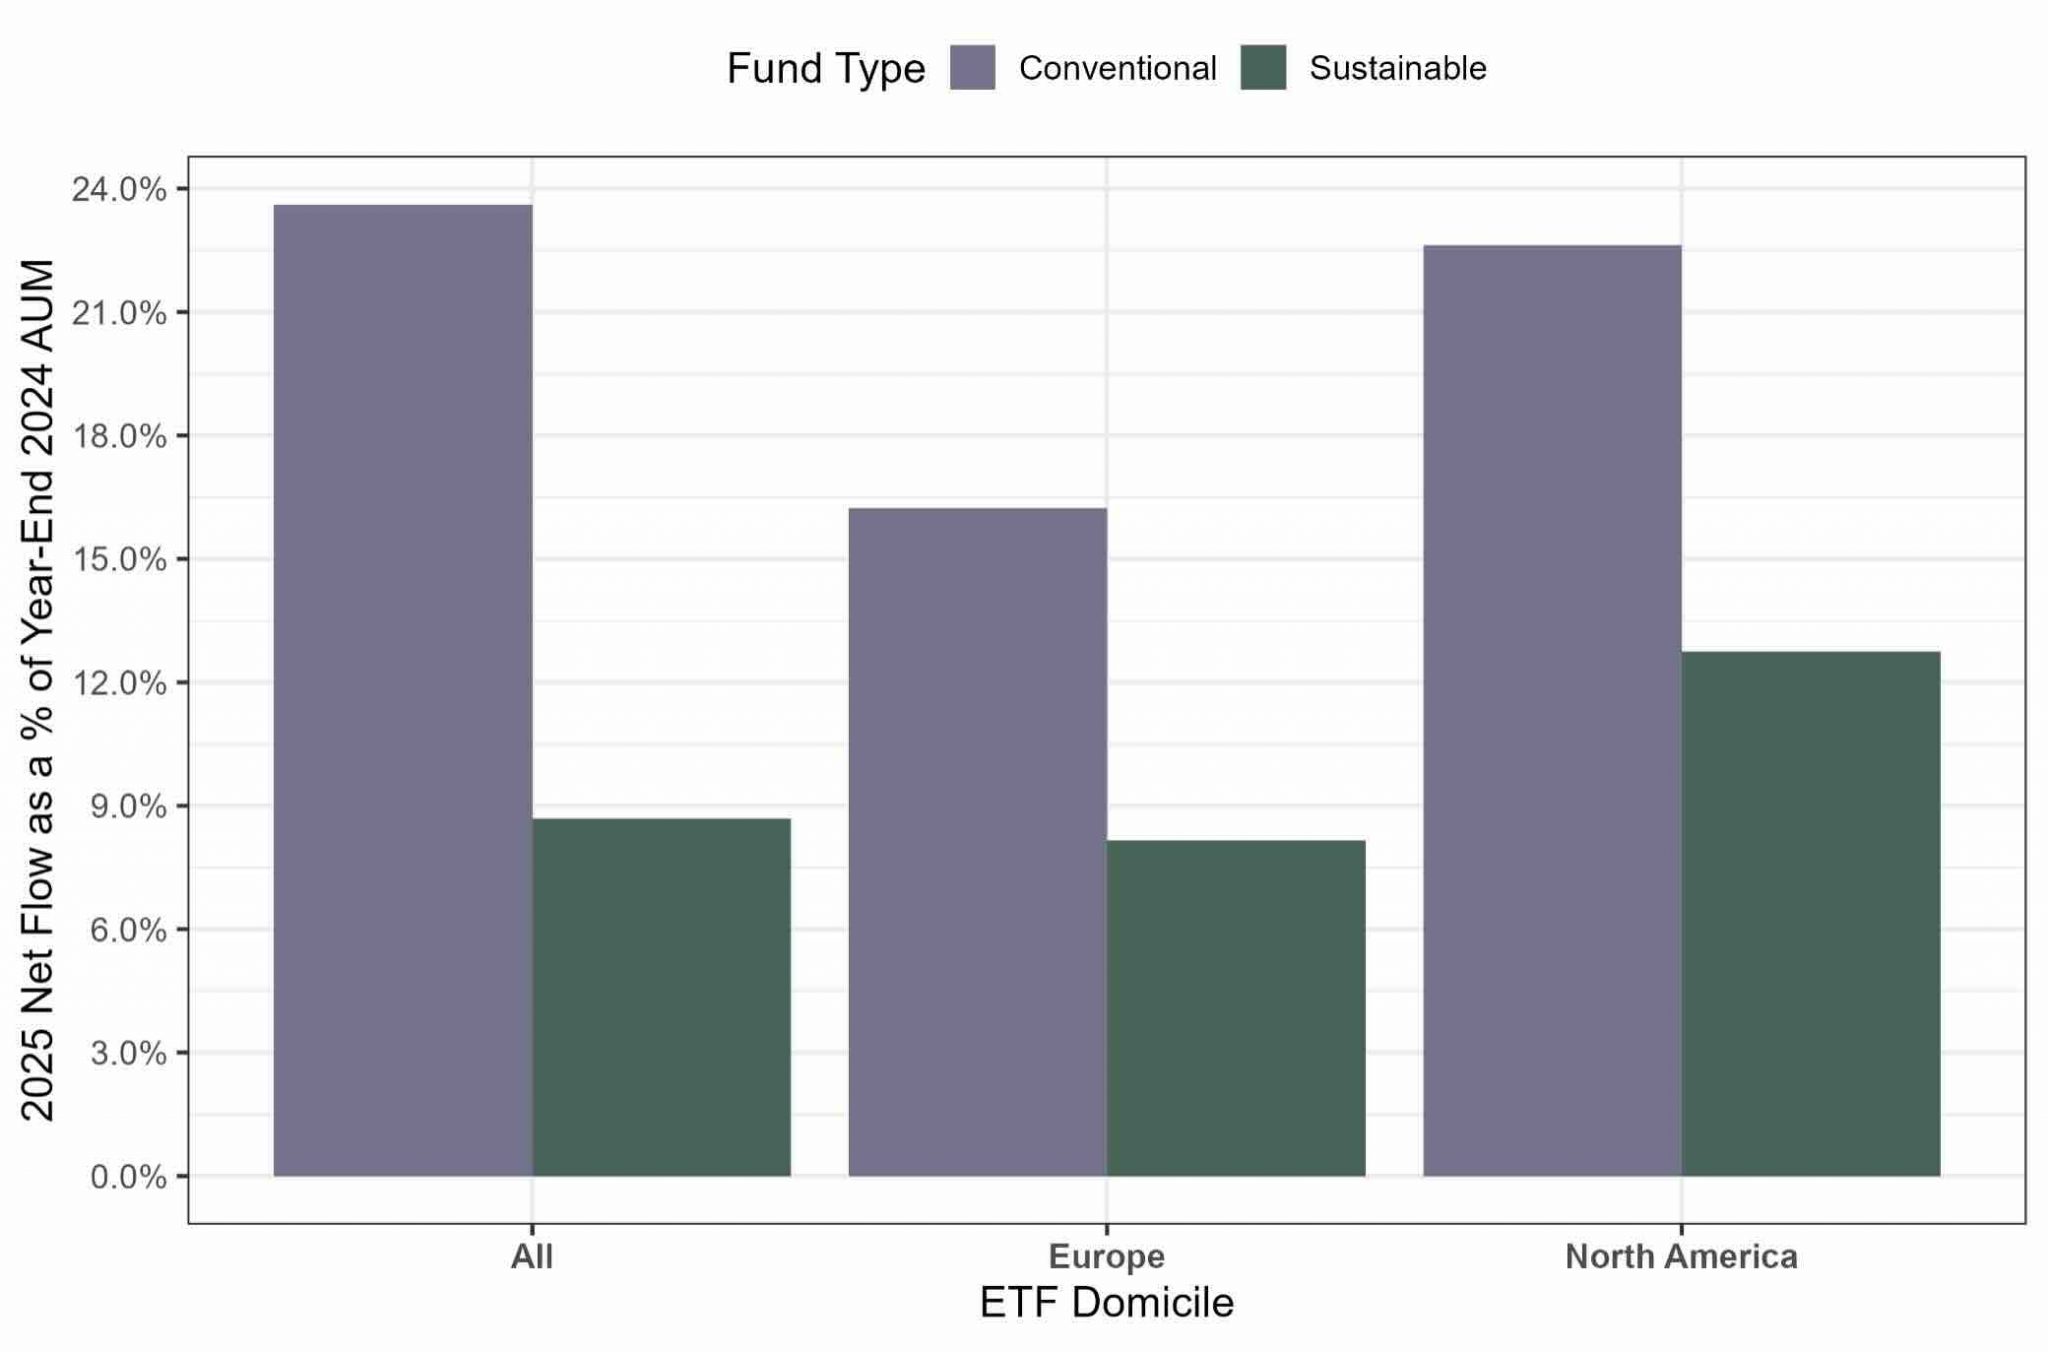
Sustainable fixed income funds received positive net new flows across all regions in 2025, totaling $56 billion, or 8.5% of AUM in 2024 (Figure 7). Growth was led by Europe which grew 8.2% ($47.8 billion) and North America, 6.7% ($3.7 billion). The trend is similar in fixed income ETFs, which saw $10.4 billion, or 8.7% of 2024 AUM, in net new flows for the year (Figure 8).
Figure 7: 2025 Sustainable and Conventional Net Flows: Fixed Income Mutual Funds and ETFs
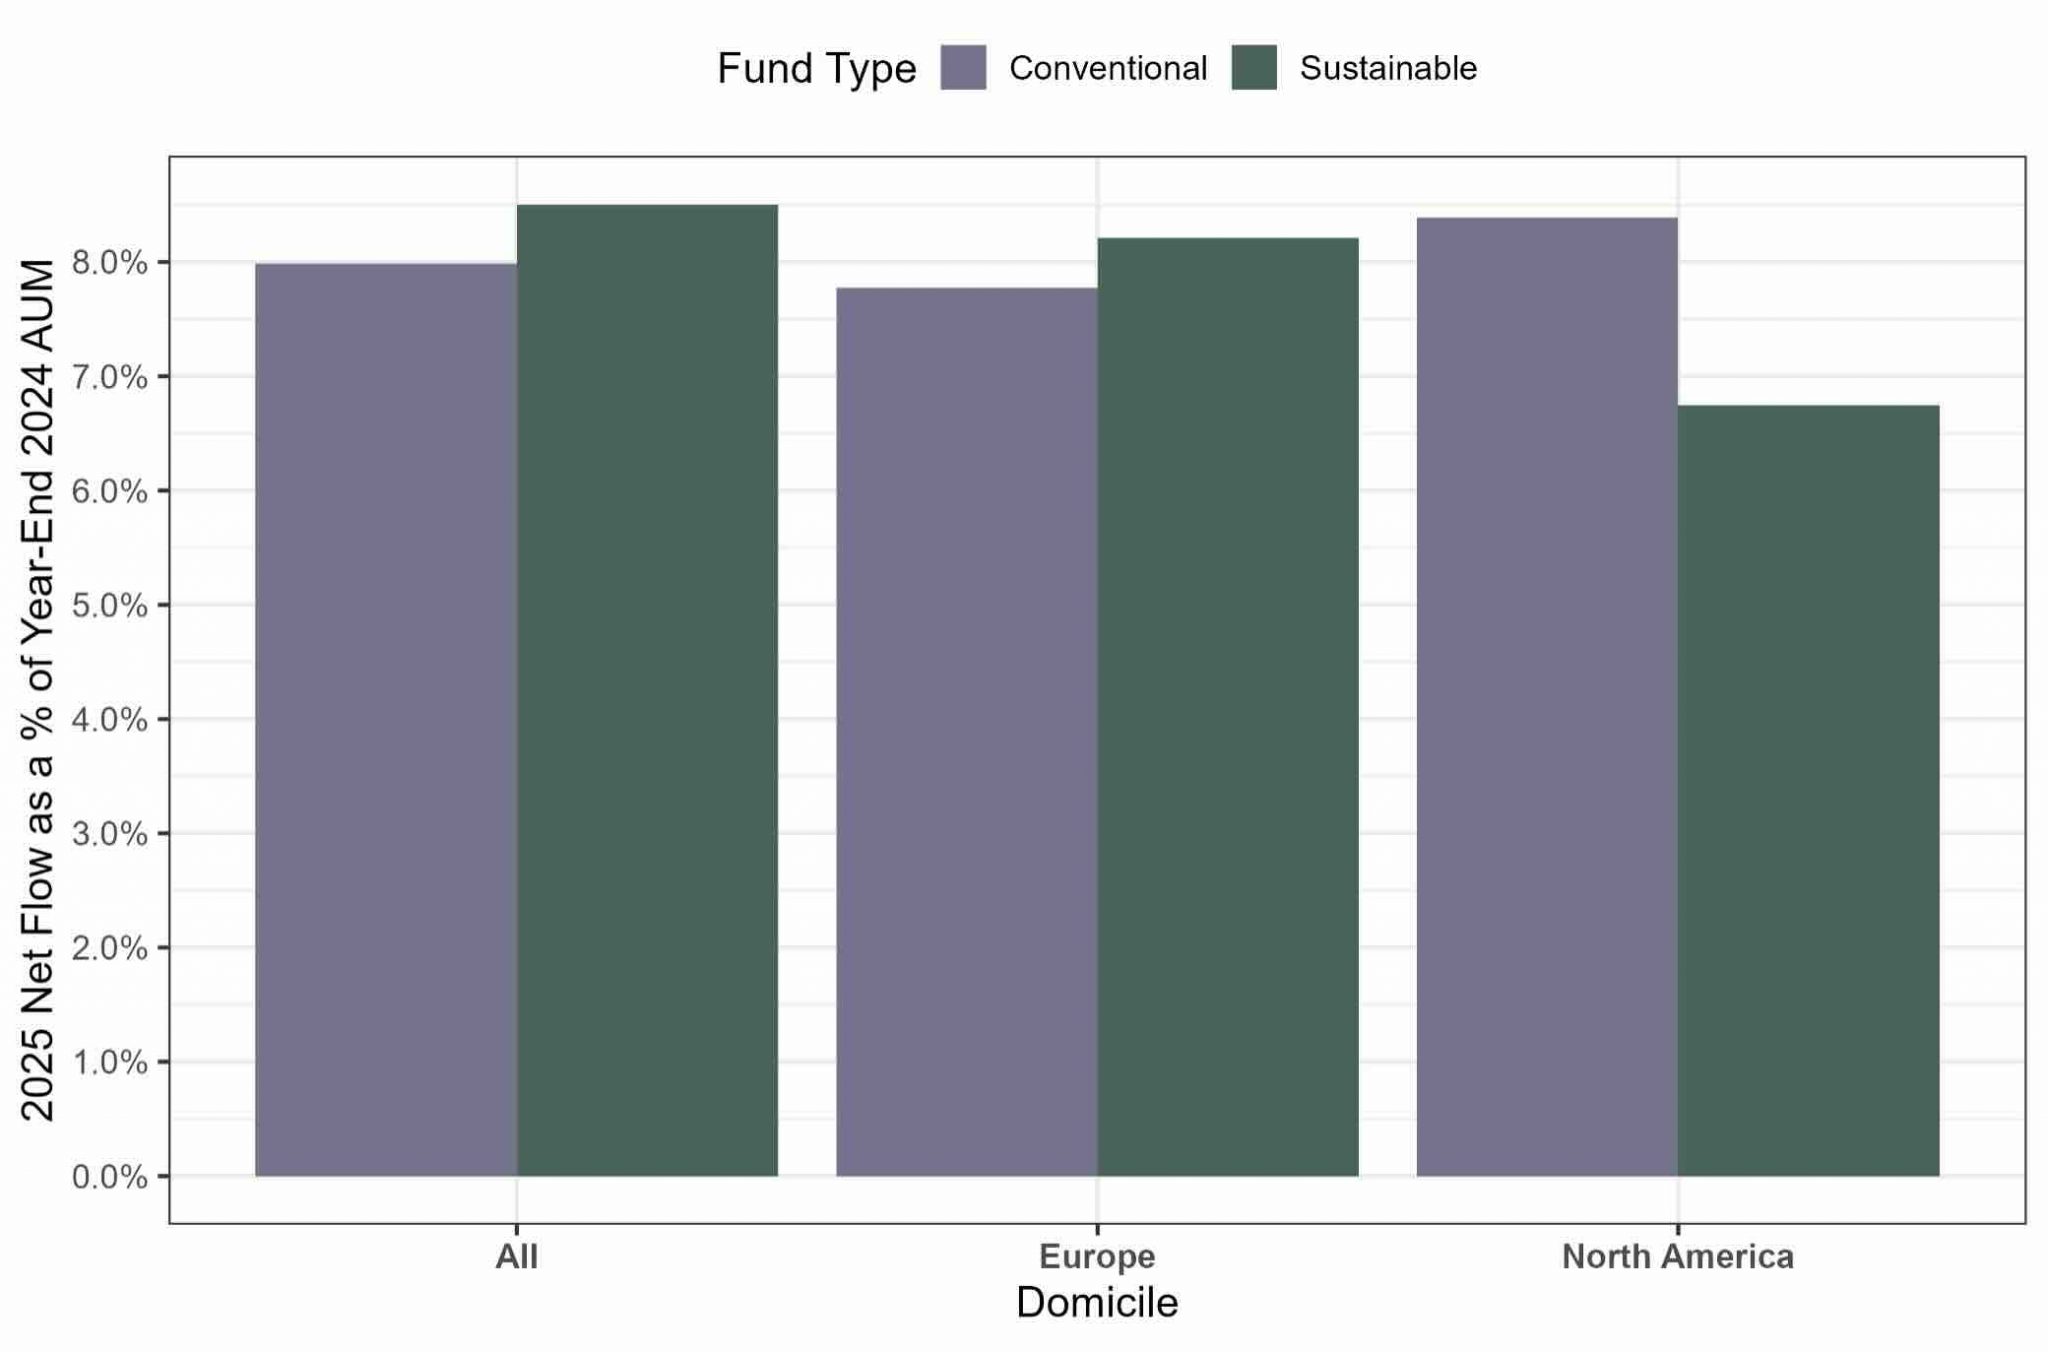
Figure 8: 2025 Sustainable and Conventional Net Flows: Fixed Income ETFs
Conclusion
Amid global cross-currents, sustainable fund assets grew significantly and reached a new high of $3.2 trillion in 2025. Most of this expansion was driven by market appreciation, rather than net inflows. One notable bright spot is the market for sustainable fixed income funds, which both grew AUM faster and attracted more net assets than conventional fixed income funds. As fixed income accounts for approximately a quarter of total sustainable funds, in coming years bonds and labelled debt could become a driver in sustainable investing’s next phase of growth.
Authored By
Hernando Cortina, ISS STOXX Sustainability
Moe Phyu, ISS STOXX Sustainability
See More