
Key Takeaways
- Scope 3 emissions disclosure has grown rapidly, with the number of reporting companies increasing by more than 12% each year since 2020.
- Data quality has not kept pace with disclosure, with a significant share of reported Scope 3 data continuing to fail quality reviews and requiring replacement with modelled estimates.
- Incomplete coverage and inconsistent reporting boundaries remain the primary drivers of data rejection, particularly in emissions-intensive sectors such as Financials, Energy, and Industrials.
- Financed emissions (Category 15) are frequently omitted by financial institutions, materially understating the institutions’ true climate risk exposure.
- Modelled emissions remain necessary to ensure comparability, consistency, and complete portfolio-level climate risk analysis.
Introduction
Over the past five years, disclosure of Scope 3 emissions has increased significantly across global markets. However, this growth in reported data has not been matched by a corresponding improvement in data quality. Examining publicly disclosed company data collected for the ISS STOXX Climate Database indicates that a substantial proportion of the Scope 3 emissions disclosed continue to fail ISS STOXX quality reviews and are consequently replaced with modelled emissions.
This article examines the drivers behind these data rejections and explores how Scope 3 data quality varies across sectors and regions. The article highlights both geographic patterns and temporal trends in Scope 3 reporting within today’s reporting landscape.
Why Quality Matters for Scope 3 Emissions
Scope 3 emissions represent indirect greenhouse gas emissions that occur across a company’s value chain. As defined by the GHG Protocol Corporate Value Chain (Scope 3) Standard, they typically constitute the largest share of the total corporate emissions footprint, particularly in sectors such as Financials, Industrials, Energy, and Consumer Discretionary.
At the same time, the standard explicitly recognizes Scope 3 emissions as the most methodologically complex component of emissions reporting. Scope 3 calculation approaches rely heavily on assumptions, data proxies, and boundary judgements, all of which can materially influence reported outcomes. Accordingly, Scope 3 emissions guidance emphasizes that reported results are highly sensitive to methodological choices, making unchecked aggregation analytically risky and potentially misleading.
From a data quality standpoint, variability in reported Scope 3 emissions data highlights an important distinction between completeness of disclosure and the availability of emissions data that is genuinely useful for decision making.
Research for the Climate Database on company disclosures indicates that reported Scope 3 emissions data may understate exposure due to missing categories, incomplete boundaries, or inconsistent methodologies and so can create a misleading impression of comparability or progress. In such situations, modelled estimates grounded in sector-specific expectations and applied with methodological consistency can offer a more reliable foundation for analysis.
All reported Scope 3 data is reviewed by experienced analysts. Where disclosures are partial, exclude material sector‑relevant categories, or show inconsistencies in coverage, boundaries, or calculation methods, the reported data is not used. In such cases, modelled Scope 3 estimates are used in the Climate Database, and the reported data is classified as “Scope 3 rejected data.” In such cases, rejection reflects a data-quality intervention aimed at preserving analytical robustness, not an assessment of corporate intent.
Overview of the Reported Scope 3 Emissions Data
The Climate Database covers over 31,000 companies globally and includes Scope 1, 2, and 3 emissions data across the investment universe. In 2024, reported Scope 3 emissions data for approximately 5,200 companies successfully passed quality review, while reported data for around 2,500 companies failed to meet quality standards and was therefore replaced with modelled emissions in the final database.
The number of companies disclosing Scope 3 emissions has increased materially over time, rising from approximately 4,800 companies in 2020 to around 7,700 companies in 2024, representing a compound annual growth rate (CAGR) of 12.2% over the period (Figure 1).
Figure 1: Number of Companies Reporting Scope 3 Data versus Rejected‑to‑Reported Ratio, 2020-2024
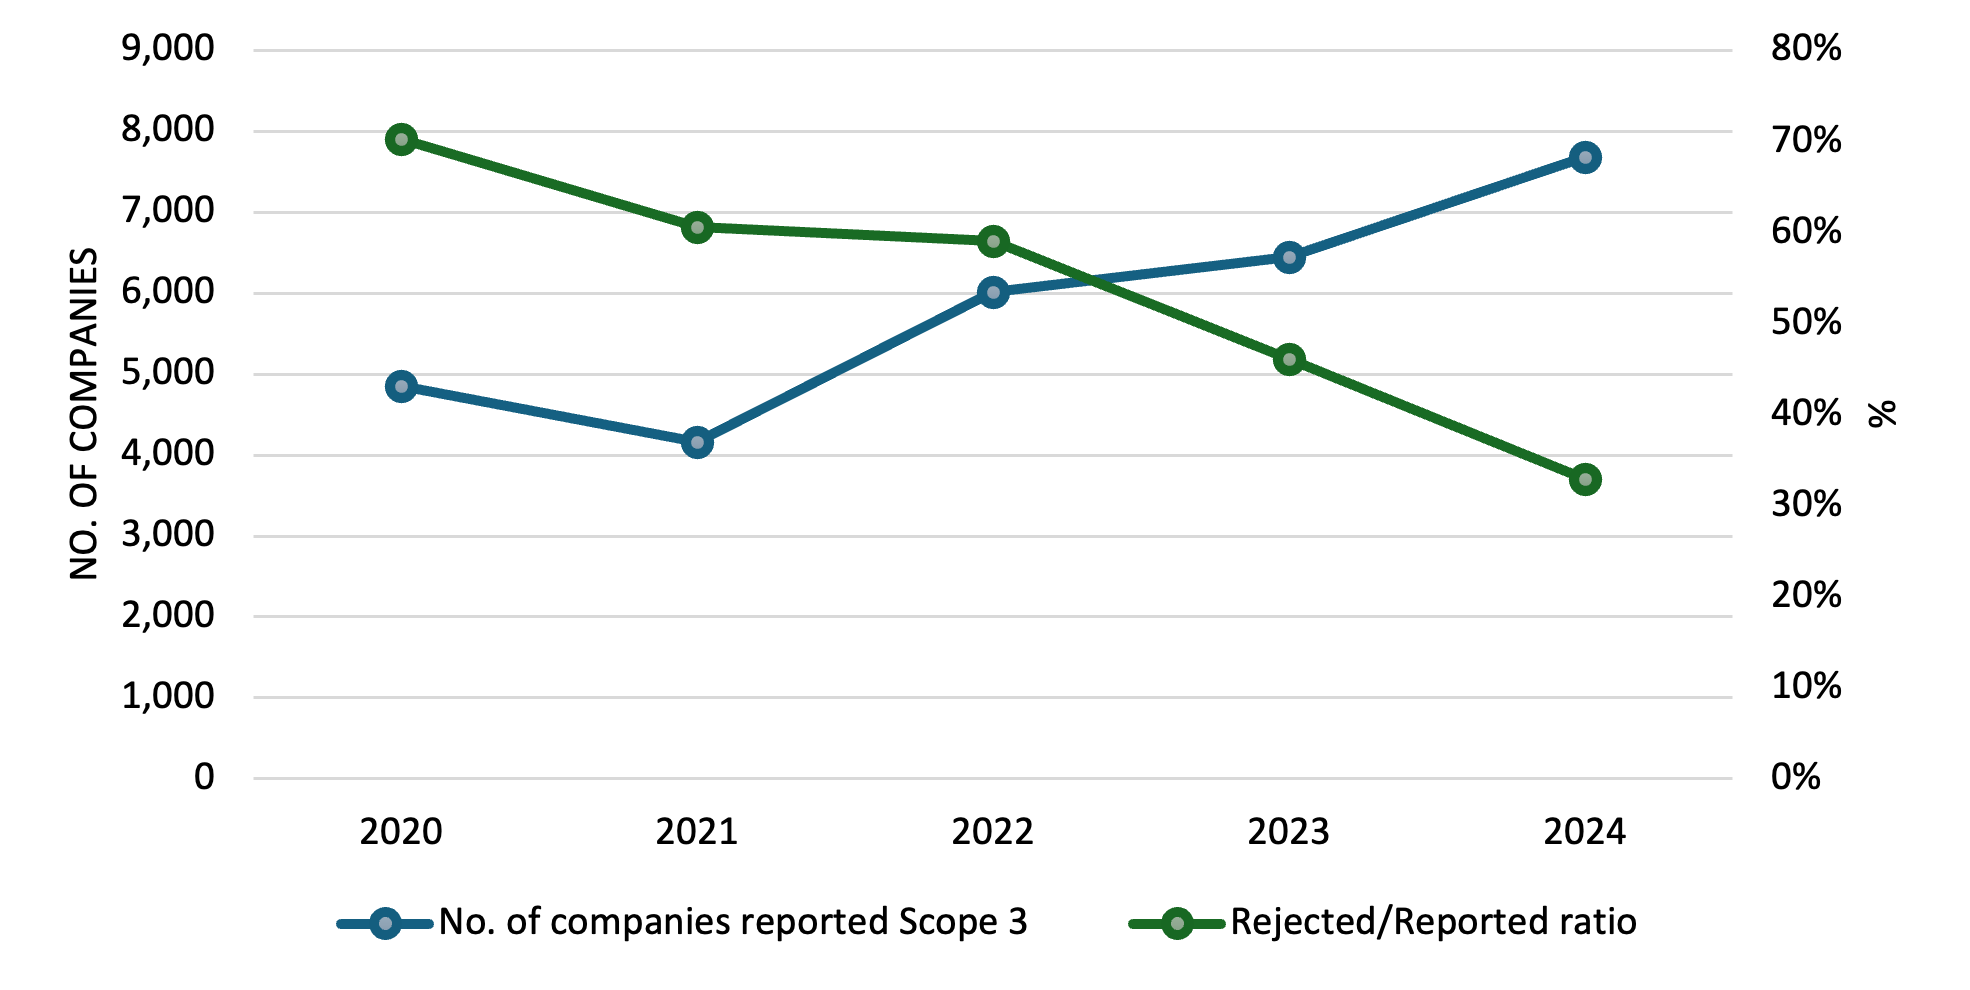
Source: Climate Database
Over the same timeframe, the share of rejected reported Scope 3 emissions data declined significantly from over 70% in 2020 to approximately 33% in 2024.
While this trend points to improving consistency and coverage in Scope 3 reporting, it does not yet indicate full data maturity. The quality rejections underscore the continued importance of systematic data validation and the targeted use of modelled emissions to support comparability and analytical reliability in an evolving disclosure landscape.
Sectoral Trend in Rejected Scope 3 Emissions
According to the CDP, the Financial sector’s true climate impact is largely obscured, as the vast majority of its carbon footprint (near about 99%) stems from its investment activities rather than its direct or indirect operational emissions. Figure 2 shows the relatively large numbers of Financial sector companies to have their Scope 3 Emissions rejected.
Figure 2: Trend in Number of Companies to Have Scope 3 Emissions Rejected, by Sector (2020–2024)
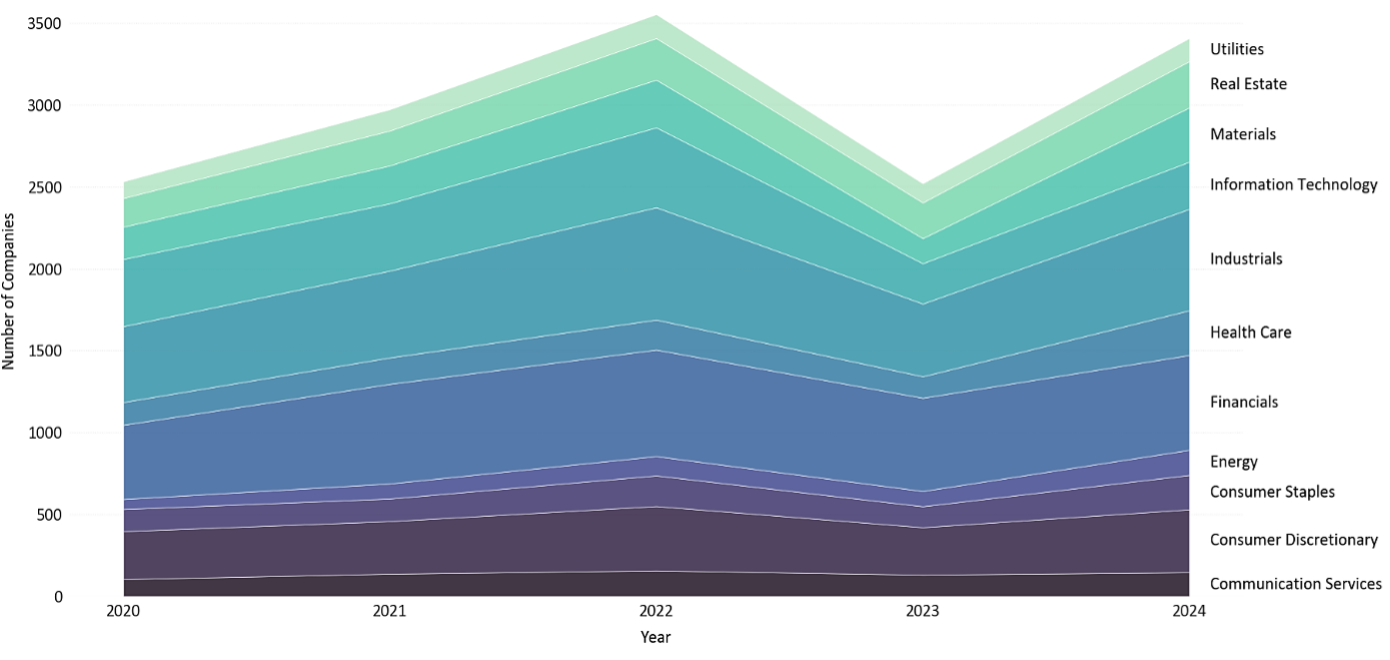
Source: Climate Database
The primary driver of data rejection is the widespread omission of Category 15 (Financed Emissions), which represents the dominant source of Scope 3 emissions for institutions in the Financial sector. Due to data quality issues, a mere 17% of financial institutions in the Climate Database managed to disclose reliable Category 15 emissions in 2024.
In addition, data comparability is undermined by inconsistent treatment of the Scope 1, 2, and 3 emissions of investee companies. Financial institutions frequently report only partial figures, reflecting fragmented disclosures and the absence of a mandatory global reporting standard.
In the absence of financed emissions, reported Scope 3 data for financial institutions is largely limited to categories such as business travel, purchased goods and services, and employee commuting, while excluding emissions associated with loans, investments, assets under management, and insurance portfolios. As a result, the reported data fails to capture the institution’s true climate risk exposure. For portfolio‑level risk and transition analysis, such partial disclosures can be materially misleading and are therefore rejected and replaced with modelled estimates.
Companies in the Energy sector have steadily expanded Scope 3 disclosure over time; however, many still provide incomplete coverage of Category 11 (Use of Sold Products). Similarly, Industrials sector companies often report only a subset of upstream emissions, typically limited to tier one suppliers. These constrained reporting boundaries lead to systematic underestimation of full life-cycle emissions, complicating peer comparisons and weakening the robustness of transition‑risk assessments.
By contrast, Utilities sector companies exhibit consistently lower rejection rates. Their primary Scope 3 emissions sources, fuel supply and purchased electricity for resale, are fundamental to their business models, more readily quantifiable, and reported with greater consistency across the sector.
Regional Trends in Rejected Scope 3 Emissions
As shown in Figure 3, rejected Scope 3 emissions are analyzed across both regions and sectors. The majority of companies with rejected data originate from Asia and North America, spanning nearly all sectors.
Figure 3: Number of Companies to Have Scope 3 Emissions Rejected, by GICS Sector and Region, for 2024
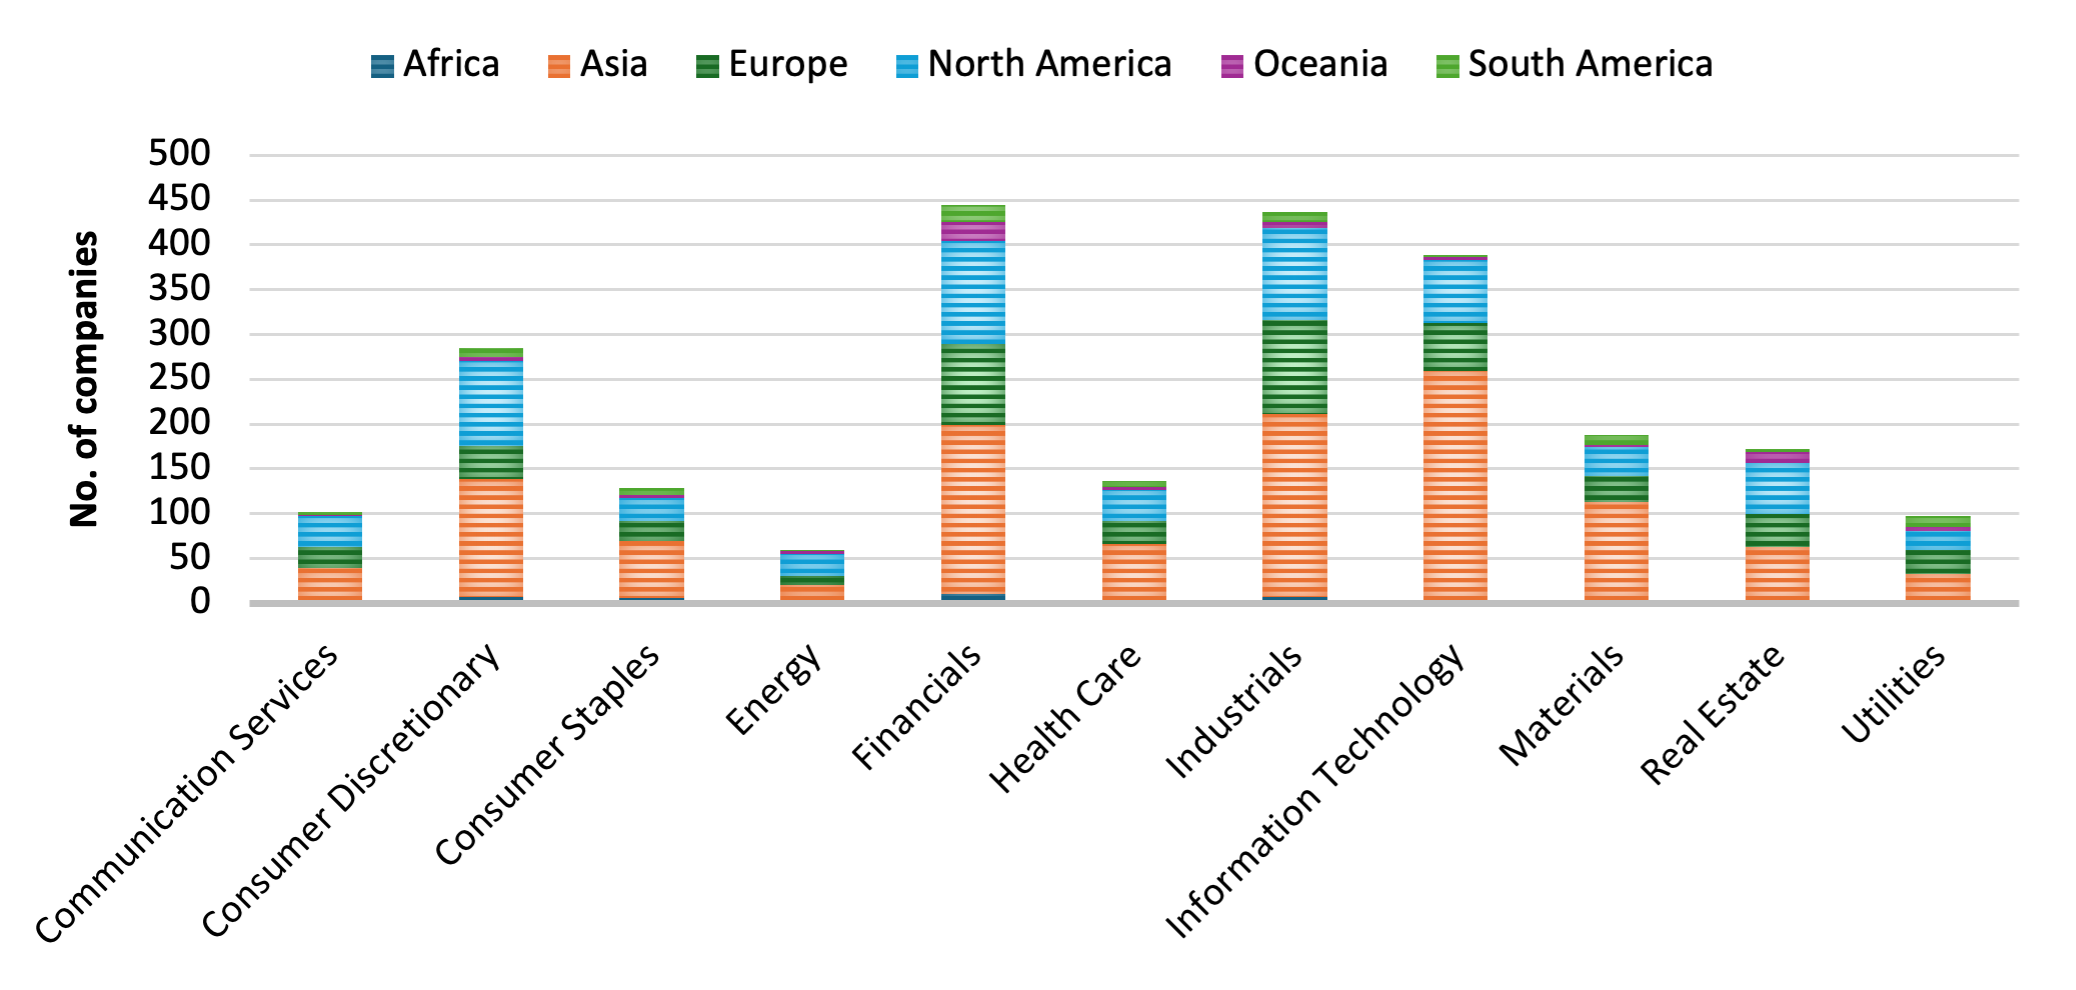
Source: Climate Database
In Asia, many companies depend on large, complex supplier networks. This often leads to the companies using older (lag‑year) data and not covering the full upstream supply chain. In North America, companies are more likely to disclose less material Scope 3 categories while omitting the primary emissions drivers, leading to partial and unrepresentative reporting.
By contrast, Europe exhibits relatively lower company rejection rates in proportion to its volume of reporting companies. These low rejection rates reflect earlier adoption of regulatory frameworks and emissions reporting standards among European companies.
These regional disparities in data quality introduce potential gaps in global cross‑company comparisons. The use of modelled emissions data helps mitigate this imbalance by providing a more consistent and comparable basis for analysis across regions and sectors.
Looking ahead, emerging regulatory frameworks are expected to influence reporting practices across regions. Emerging disclosure frameworks such as the Corporate Sustainability Reporting Directive (CSRD) and the adoption of International Sustainability Standards Board (ISSB)-aligned standards are expected to improve Scope 3 coverage and methodological consistency over time. However, given implementation timelines, transitional reporting practices, and continued reliance on estimates and proxies, data will remain inconsistent for a while.
Figure 4 portrays a consistent decline in Scope 3 rejections across regions, although the pace of improvement varies. The figure shows an overall decline in Scope 3 rejections, but two distinct reporting patterns emerge across regions. Europe follows a sharp improvement trajectory, with rejections declining from nearly 70% in 2020 to 20% in 2024. This trend suggests that earlier high rejection levels were linked to broader and more complex boundary definitions, which stabilized as methodologies and internal controls matured.
Figure 4: Scope 3 Emissions Data Rejection Percentages, by Region (2020–2024)
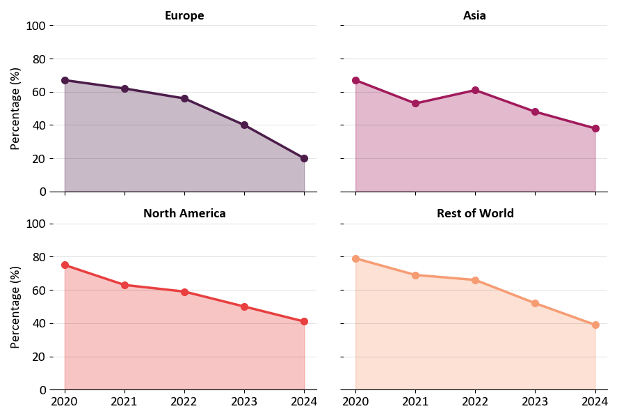
Source: Climate Database
In contrast, Asia and North America display more gradual and less uniform declines. Asia’s temporary increase around 2022 indicates that progress is not linear, and that expanding into more complex categories can reintroduce data quality challenges before improvements materialize.
The Rest of World starts from the highest rejection levels and declines steadily, pointing to more structural challenges in early-stage reporting, followed by incremental system and process improvements.
Overall, the regional shifts reflected in the Climate Database reinforce the key lesson discussed above: Scope 3 rejections are better explained not only by the ability of reporters themselves but also by the differences in how reporting boundaries are set and how established internal data and review frameworks are. As practices converge globally, regional differences are narrowing and becoming more predictable.
Conclusion
For investors and risk managers, these findings could reinforce the importance of looking beyond headline disclosure metrics. Improvements in reporting volumes may mask underlying gaps in emissions coverage and comparability, underscoring the need for validated, harmonized datasets when conducting portfolio‑level climate risk.
The analysis demonstrates that while Scope 3 emissions disclosure has expanded rapidly across global markets, improvements in data reliability and methodological consistency have lagged. Structural limitations, including incomplete category coverage, truncated reporting boundaries, and uneven regional reporting practices continue to constrain the usability of reported Scope 3 emissions for institutional‑grade climate analysis.
As a result, modelled Scope 3 emissions could be critical to fill the gap. They enable cross‑sectional comparability, consistency, and comprehensive portfolio coverage in an environment where reported data alone is often incomplete or misleading. Until Scope 3 emissions reporting becomes more standardized across sectors and regions, rigorous data validation processes and stochastic modelling will continue to play an essential role in producing decision‑useful climate metrics for investors and risk managers.
Your Feedback Matters
Let us know how this research resonated with you. Your input helps us develop content that resonates with investors across the globe.

Authored By
Hemant Patra, Analyst, Climate Research and Analytics, ISS STOXX
Rushikesh Hiwrekar, Analyst, Climate Research and Analytics, ISS STOXX
See More